# Adding Resilience To 60-40 Portfolios
Source: https://www.yieldcurve.pro/blog/adding-resilience-to-60-40-portfolios
Published: 2023-10-16
Tags: 60-40 Portfolios, Alternatives, Bond Beta, Bonds, ETFs, GICS, Government Bonds, Stock Beta, Stocks, Yield Curve
_How can we complement traditional 60-40 portfolios with alternative sources of return that provide diversification?_
# Adding Resilience To 60-40 Portfolios
In our
last
blog post we examined the differences in comovements between equity sectors
and rates. We ended by suggesting that one interesting aspect of the analysis
was its ability to select asset classes that could be additive to an existing
stock-bond (e.g., 60-40) allocation. By selecting assets that are additive on
a return basis, while providing as little exposure as possible to our chosen
stock or bond index, can we add value?
Again, this allows us to answer questions like
- do commodities add anything to this allocation?
- should I add corporate debt or is that just doubling down on the leveraged
equity bet I already have?
These are interesting questions that we will attempt to answer in this post.
We follow the same approach as last time [^1],[^2] which explains asset
excess returns using a multivariate regression of the form shown in Equation 1.
$$
r_{at} - r_f = \alpha_a + \beta_{m}\left(r_{mt} - r_f\right) +
\beta_{b}\left(r_{bt} - r_f\right) + \epsilon_{at} \qquad\qquad\qquad\qquad (1)
$$
where
$$r_{at} := \text{alternative asset class return}$$
$$r_{mt} := \text{stock market return}$$
$$r_{bt} := \text{bond market return}$$
$$r_f := \text{risk free rate}$$
$$\alpha_a := \text{intercept}$$
$$\beta_{m} := \text{stock market exposure}$$
$$\beta_{b} := \text{bond market exposure}$$
As a reminder we use the easily accessible ETFs shown in Table 1 as proxies for
the different components (stocks, bonds, and cash) in Equation 1.
| Ticker | Description | Asset Class |
| :------: | :--------------------- | :---------- |
| IWB | Russell 1000 | Stocks |
| IEF | 7-10 Year Treasury | Bonds |
| BIL | 1-3 Month T-Bill | Cash |
#### **Table 1**: ETF Proxies for Stocks, Bonds, and Cash
The alternative asset classes we consider are comprised of a non-exhaustive
list of ETFs that are (as usual) readily available to retail investors via
any easily accessible brokerage account. Those ETFs are shown in Table 2
in no particular order.
| Ticker | Description |
|:---------|:----------------------------------------------------|
| PFF | iShares Preferred and Income Securities |
| AGG | iShares Core US Aggregate Bond |
| LQD | iShares iBoxx $ Investment Grade Corporate Bond |
| MUB | iShares National Muni Bond |
| VTEB | Vanguard Tax-Exempt Bond |
| HYG | iShares iBoxx $ High Yield Corporate Bond |
| JNK | SPDR Bloomberg Barclays High Yield Bond |
| IYR | iShares U.S. Real Estate |
| DBC | Invesco DB Commodity Index Tracking Fund |
| GSG | iShares S&P GSCI Commodity-Indexed Trust |
| GLD | SPDR Gold Shares |
| FXE | Invesco CurrencyShares Euro Currency Trust |
| UUP | Invesco US Dollar Index Bullish Fund |
#### **Table 2**: Alternative Asset Class ETFs
Table 3 shows the excess returns and volatilities for each of the
alternative ETFs.
| Ticker | Description | Ex Ret (%) | Ex Vol (%) | IR |
|:---------|:--------------- -----------------------------------|-------------:|-------------:|------:|
| FXE | Invesco CurrencyShares Euro Currency Trust | -2.03 | 9.38 | -0.22 |
| GSG | iShares S&P GSCI Commodity-Indexed Trust | -1.69 | 24.45 | -0.07 |
| DBC | Invesco DB Commodity Index Tracking Fund | 1.43 | 19.92 | 0.07 |
| VTEB | Vanguard Tax-Exempt Bond | 0.50 | 5.47 | 0.09 |
| UUP | Invesco US Dollar Index Bullish Fund | 0.96 | 8.31 | 0.12 |
| PFF | iShares Preferred and Income Securities | 4.12 | 20.08 | 0.21 |
| IYR | iShares U.S. Real Estate | 7.12 | 30.57 | 0.23 |
| JNK | SPDR Bloomberg Barclays High Yield Bond | 4.20 | 12.71 | 0.33 |
| HYG | iShares iBoxx $ High Yield Corporate Bond | 3.93 | 11.77 | 0.33 |
| AGG | iShares Core US Aggregate Bond | 1.89 | 5.53 | 0.34 |
| LQD | iShares iBoxx $ Investment Grade Corporate Bond | 3.22 | 9.33 | 0.35 |
| GLD | SPDR Gold Shares | 6.94 | 17.67 | 0.39 |
| MUB | iShares National Muni Bond | 2.22 | 5.63 | 0.40 |
#### **Table 3**: Alternative Asset Class ETF Summary Statistics
As before, we estimate the parameters in Equation 1 using daily returns and 256
day rolling windows which results in Figures 1, 2, and 3.
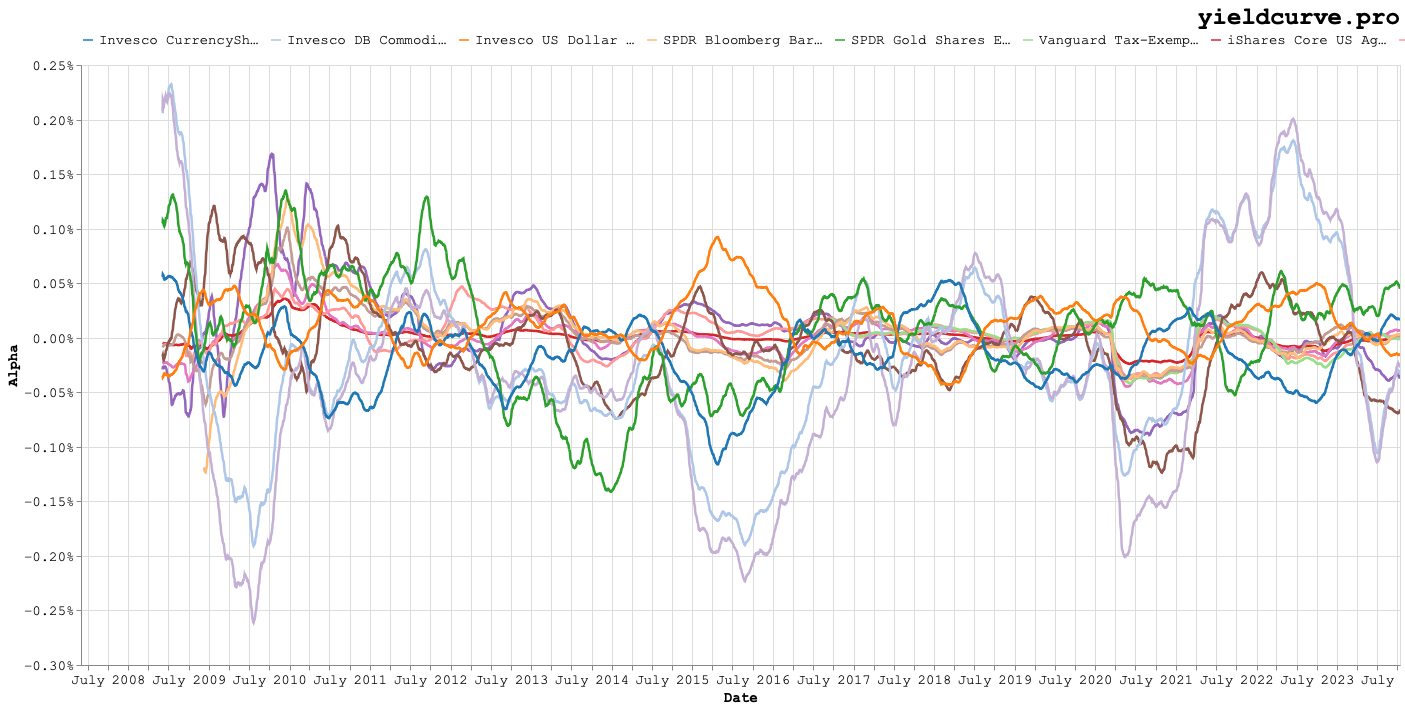 #### **Figure 1**: Rolling Alpha (Intercept) Term by Alternative Asset Class
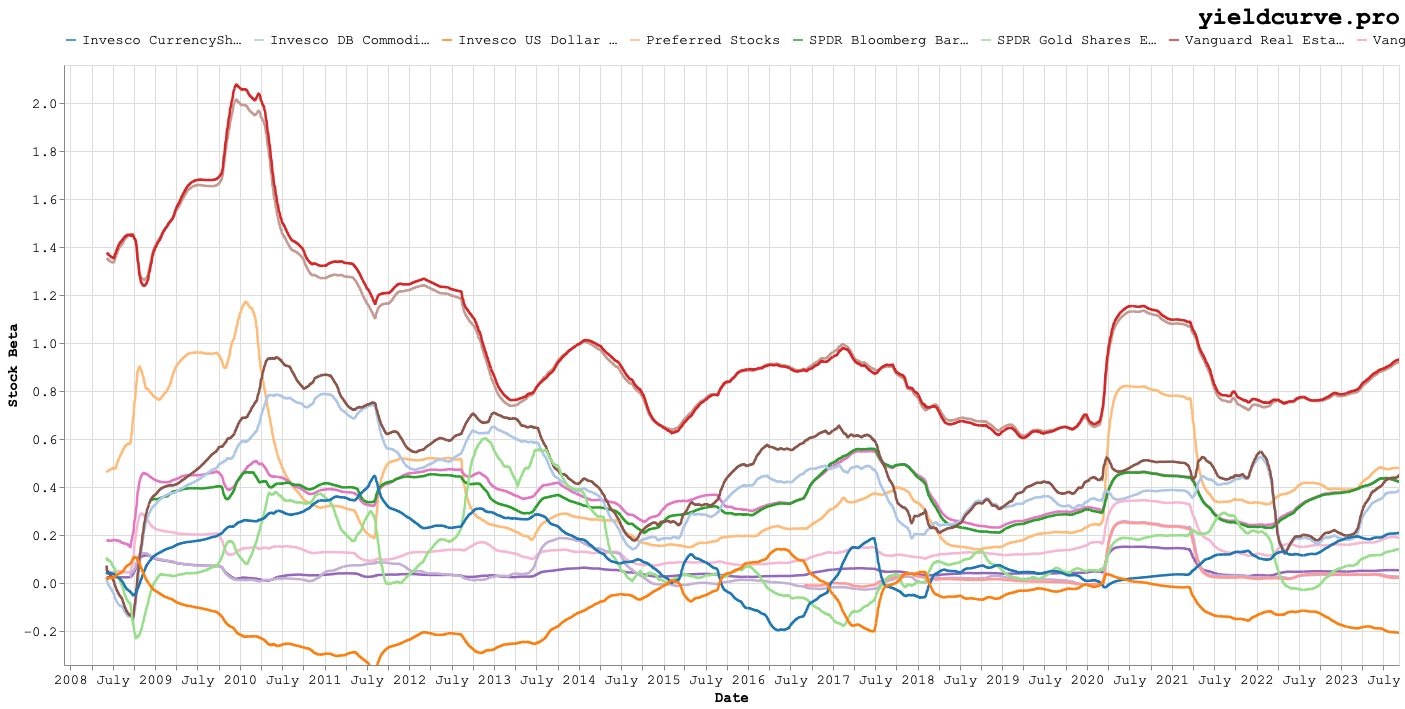 #### **Figure 2**: Rolling Stock Beta by Alternative Asset Class
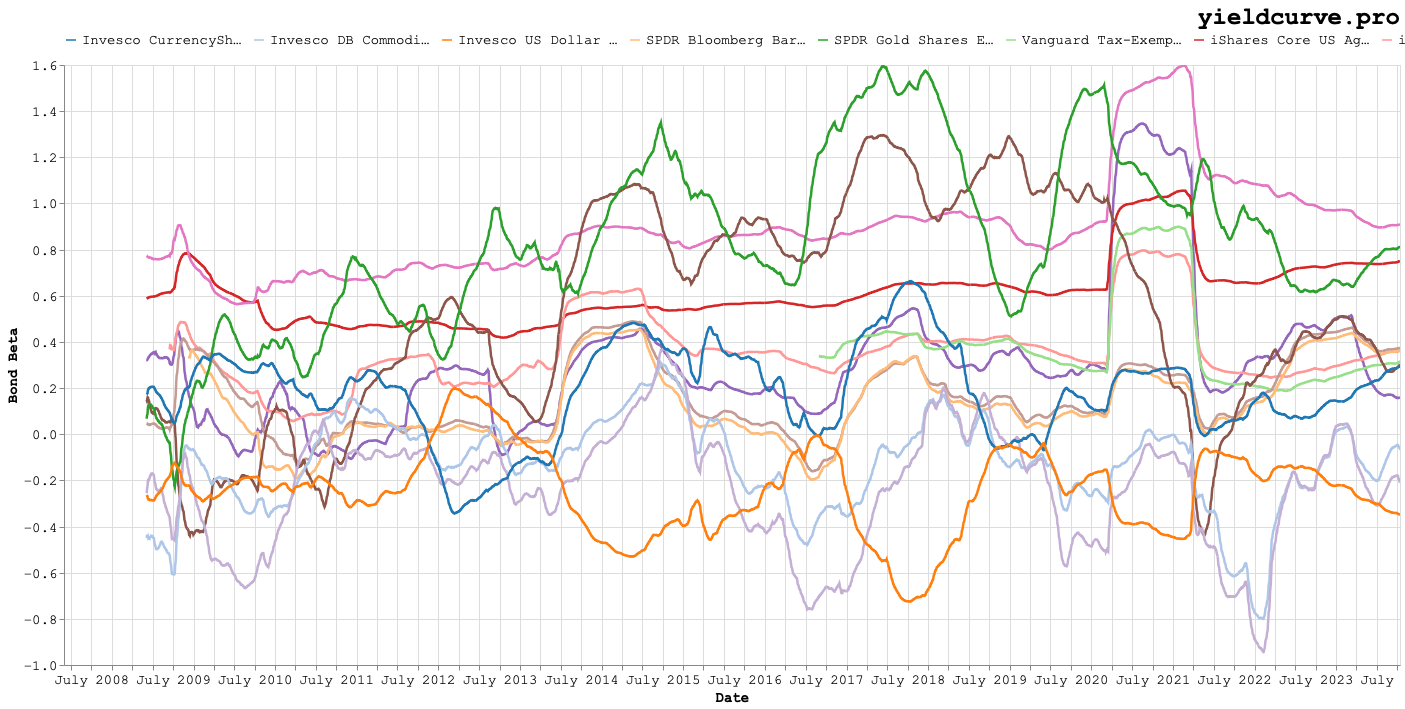 #### **Figure 3**: Rolling Bond Beta by Alternative Asset Class
Generally speaking, the properties we are attempting to identify from Figures 1,
2, and 3 are asset classes with high alpha and low exposures (betas) to our
chosen stock and bond indices. As before, while we can speculate on what is
happening by visual inspection of the charts, a table of averages makes empirical
comparisons easier.
Table 4 shows average values for the esimated regression parameters.
| Ticker | Description | Alpha (%) | Stock Beta | Bond Beta |
|:---------|:-------------------------------------------------|------------:|-------------:|------------:|
| GSG | iShares S&P GSCI Commodity-Indexed Trust | -8.67 | 0.47 | -0.23 |
| DBC | Invesco DB Commodity Index Tracking Fund | -4.63 | 0.40 | -0.13 |
| FXE | Invesco CurrencyShares Euro Currency Trust | -4.28 | 0.12 | 0.18 |
| IYR | iShares U.S. Real Estate | -1.27 | 1.00 | 0.54 |
| VTEB | Vanguard Tax-Exempt Bond | -0.58 | 0.05 | 0.40 |
| LQD | iShares iBoxx $ Investment Grade Corporate Bond | 0.27 | 0.15 | 0.89 |
| AGG | iShares Core US Aggregate Bond | 0.32 | 0.05 | 0.61 |
| HYG | iShares iBoxx $ High Yield Corporate Bond | 0.80 | 0.37 | 0.16 |
| MUB | iShares National Muni Bond | 1.20 | 0.05 | 0.36 |
| JNK | SPDR Bloomberg Barclays High Yield Bond | 1.27 | 0.36 | 0.13 |
| PFF | iShares Preferred and Income Securities | 1.50 | 0.40 | 0.30 |
| GLD | SPDR Gold Shares | 1.78 | 0.13 | 0.83 |
| UUP | Invesco US Dollar Index Bullish Fund | 3.26 | -0.11 | -0.25 |
#### **Table 4**: Average Multivariate Regression Parameters by Alternative Asset Class
Based on the estimated alpha contributed by commodities, we think it is safe
to assume that they are not additive. A more interesting observation is that
REITs aren't much better. They detract alpha but with full equity exposure
providing stock-like risk without any of the upside. Similarly, investment
grade debt adds meager alpha with high exposure to rates. Investment grade
debt doesn't provide enough differentiated alpha to compensate us for the risk.
Gold seems to compensate us but, based on bond beta, appears to be essientally
a rates bet.
Munis, junk bonds, and preferred stock all seem to add alpha with limited
exposure to stocks and rates. Both FXE and UUP suggest that exposure to the
dollar relative to a basket of foreign developed currencies adds alpha
while be also adding diversification.
The 4 ETFs in Table 5 appear to be good candidates for further research and
could potentially be additive as long positions to traditional 60-40 portfolios.
| Ticker | Description | Alpha (%) | Stock Beta | Bond Beta |
|:---------|:-------------------------------------------------|------------:|-------------:|------------:|
| MUB | iShares National Muni Bond | 1.20 | 0.05 | 0.36 |
| JNK | SPDR Bloomberg Barclays High Yield Bond | 1.27 | 0.36 | 0.13 |
| PFF | iShares Preferred and Income Securities | 1.50 | 0.40 | 0.30 |
| UUP | Invesco US Dollar Index Bullish Fund | 3.26 | -0.11 | -0.25 |
#### **Table 5**: Potentially Additive Long Positions to 60-40 Portfolios
How should one go about testing
- if these are actually additive asset classes?
- the best way to construct a portoflio from these building blocks?
That will be the subject of a future blog post.
[^1]: Comovement and Predictability Relationships Between Bonds and the Cross-section of Stocks
[^2]: Interest Rate Sensitivity in the Cross-Section of Stock Returns