# Anatomy of a Failed Trade: The 2s10s Steepener
Source: https://www.yieldcurve.pro/blog/anatomy-of-a-failed-steepener
Published: 2026-03-27
Tags: Bonds, Carry, Duration, DV01, Fixed Income, Rolldown, Scenarios, Steepener, US Treasury, Yield Curve
_The 2s10s steepener requires 4x capital, carries flat, and just ran into a bear flattener. Three calculators put exact numbers on every dimension of the trade's failure — tenor by tenor, basis point by basis point._
---
title: "Anatomy of a Failed Trade: The 2s10s Steepener"
synopsis: "The 2s10s steepener requires 4x capital, carries +18 bps/yr, and just ran into a bear flattener. A step-by-step walkthrough of the trade's mechanics using three calculators — duration, rolldown, and scenarios."
tags: Bonds, Carry, Duration, DV01, Fixed Income, Rolldown, Scenarios, Steepener, US Treasury, Yield Curve
slug: anatomy-of-a-failed-steepener
date: 2026-03-26
---
# Anatomy of a Failed Trade: The 2s10s Steepener
Itai Lourie at Unstable Equilibria has now written three pieces on the 2s10s curve steepener — August 2025, December 2025, and March 2026. Each carried the same warning: the trade bleeds time, the carry is negligible, and the steepening thesis keeps not arriving. The 2s10s spread peaked at +74 bps in January. By late March: +46 bps. Morningstar called more steepening "inevitable." WisdomTree turned the thesis into a product. DoubleLine endorsed it across portfolios. All three ran into a bear flattener.
Lourie's analysis covers August 2024 through March 2026 using historical rolling returns. Our tools use today's yield curve — the specific numbers differ, but the structural dynamics are identical. Below is a step-by-step walkthrough of the trade's mechanics using three calculators on yieldcurve.pro.
## Step 1: What Is the Trade?
A 2s10s steepener bets the yield curve will get steeper — that the gap between the 10-year and 2-year yields will widen.
The position: long 2-year Treasuries, short 10-year Treasuries. If the 10-year yield rises relative to the 2-year (or the 2-year falls relative to the 10-year), the spread widens and the trade profits. But a 10-year bond moves far more per basis point of yield change than a 2-year bond. To isolate the spread bet from directional rate risk, you need to match the price sensitivity of both legs. That's called a DV01-neutral position.
## Step 2: The Duration Mismatch
DV01 — dollar value of one basis point — measures how much a bond's price moves per \$100 face when yields shift 1 bp. The duration calculator computes this for any maturity.
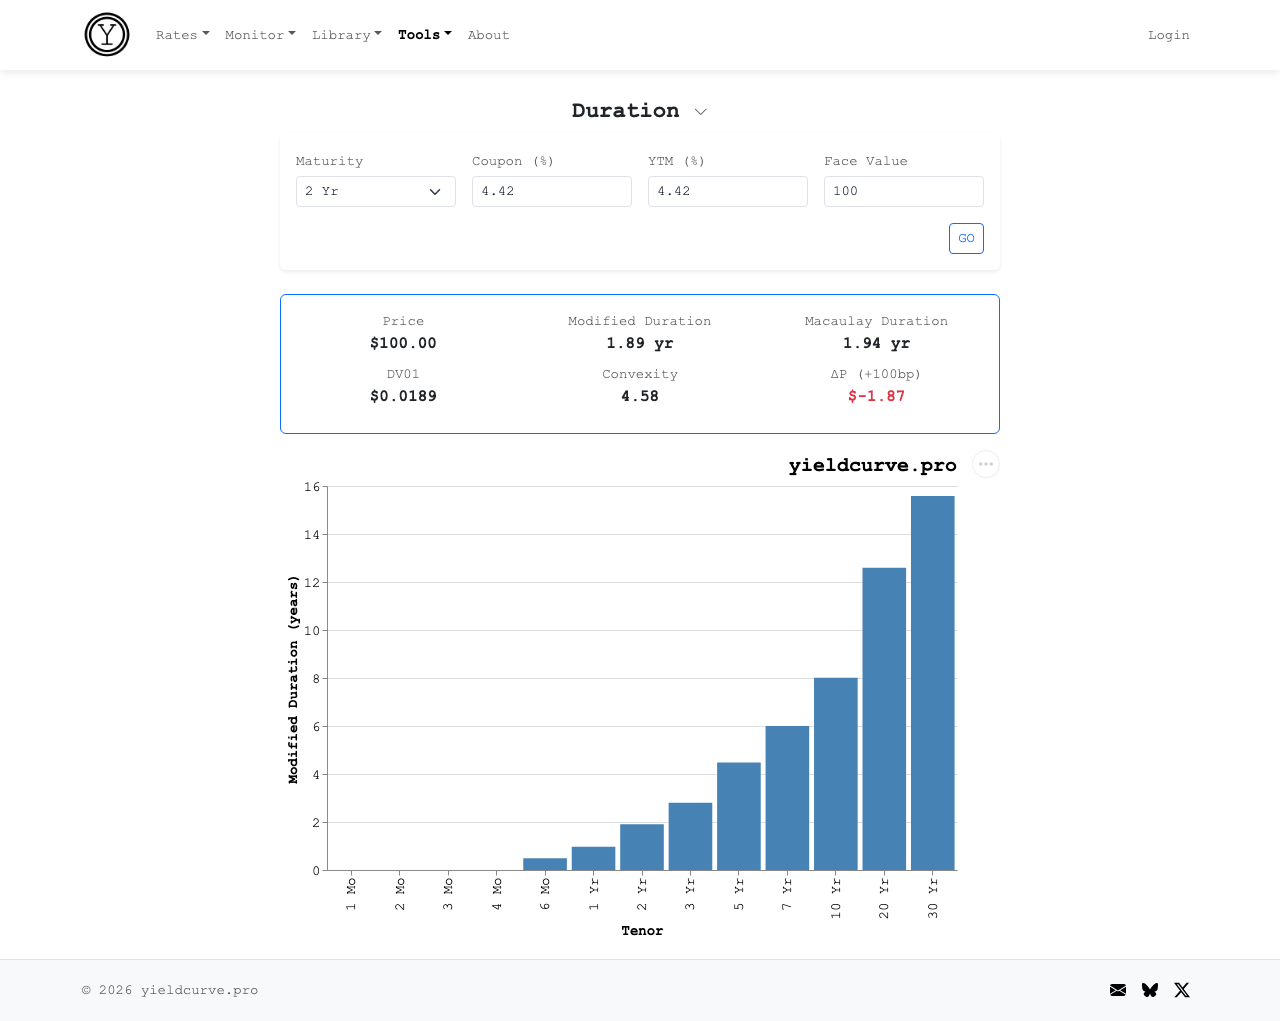
*Figure 1: A 2 Yr par bond — modified duration 1.89 years, DV01 \$0.0189 per \$100 face. If the 2 Yr yield rises 1 bp, this bond loses 1.9 cents.*

*Figure 2: A 10 Yr par bond — modified duration 8.01 years, DV01 \$0.0801 per \$100 face. A 1 bp move costs 8 cents — 4.24x the 2 Yr.*
Try the duration calculator on yieldcurve.pro
The ratio: \$0.0801 / \$0.0189 = 4.24x. To build a DV01-neutral steepener, you need \$424 of 2-year face for every \$100 of 10-year face. That matches the dollar risk — both legs move the same amount per basis point of parallel yield change. Total capital: \$524 of face value per \$100 of 10-year notional.
## Step 3: The Carry Arithmetic
While you hold a bond, it earns two kinds of return (assuming the curve doesn't move):
- **Carry**: income above the funding rate. If the bond yields 4.42% and you fund at 3.73%, carry = +69 bps/yr.
- **Rolldown**: as a bond ages, it rolls down the curve to a lower yield and gains in price.
The carry & rolldown calculator decomposes both for every tenor at a 1-year horizon:
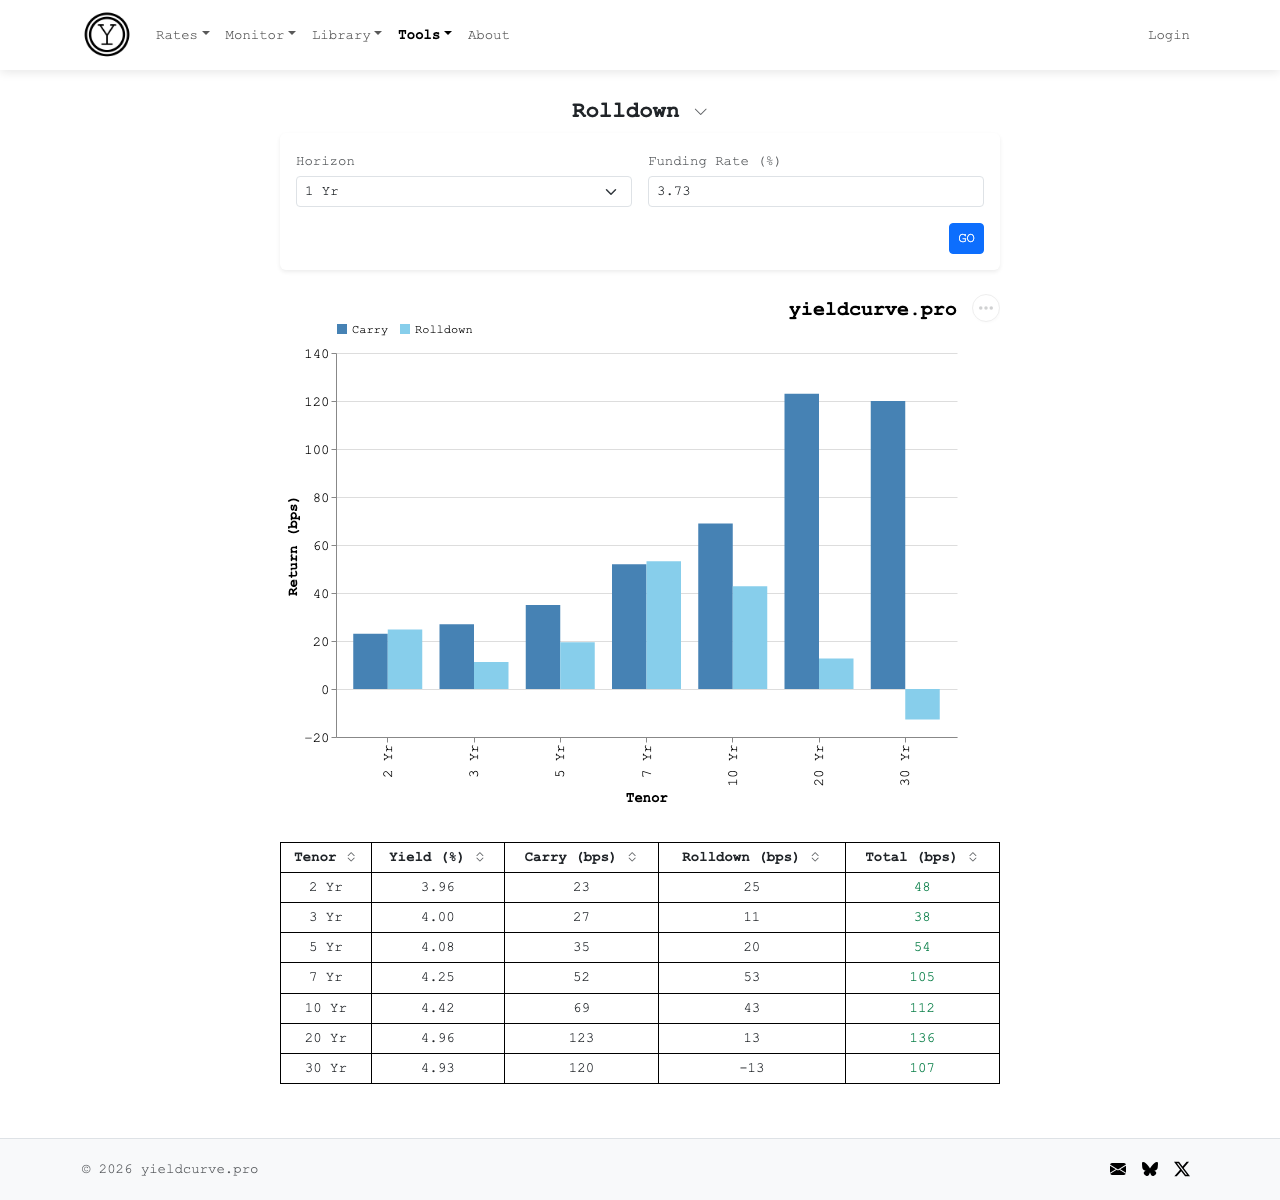
*Figure 3: Carry and rolldown by tenor over a 1 Yr horizon, funded at 3.73%. The 10 Yr earns +112 bps total. The 2 Yr earns +48 bps.*
Try the rolldown calculator on yieldcurve.pro
On the steepener, you *earn* the 2-year's return (you own it) and *pay* the 10-year's return (you're short — you owe the coupon and forfeit the rolldown). Scale to the DV01-neutral position and express in bps on the \$524 of deployed capital:
| Component | Long 2Y (\$424 face) | Short 10Y (\$100 face) | Net (bps on \$524) |
| :-------- | :------------------: | :--------------------: | :----------------: |
| Carry | +19 | −13 | **+5 bps/yr** |
| Rolldown | +20 | −8 | **+12 bps/yr** |
| **Total** | **+39** | **−21** | **+18 bps/yr** |
*Table 1: Carry and Rolldown for 2 Yr and 10 Yr Treasuries.*
The steepener earns +18 bps per year on capital. Not negative. Not zero. But razor-thin. That +18 bps is the entire cushion against any adverse spread move.
The 2s10s compressed 28 bps from January to March — roughly two months. Carry earned over that period: about +3 bps. Spread loss: −43 bps. Net: **−40 bps on capital**. The income covered 7% of the loss. Lourie calls it a carry hole. The name fits.
## Step 4: What the Trade Needed
The steepener's bull case: the Fed cuts aggressively, the front end rallies, the back end stays anchored. The scenario simulator models this — the "Bull Steepener" preset drops short rates 100 bps and leaves the long end unchanged.
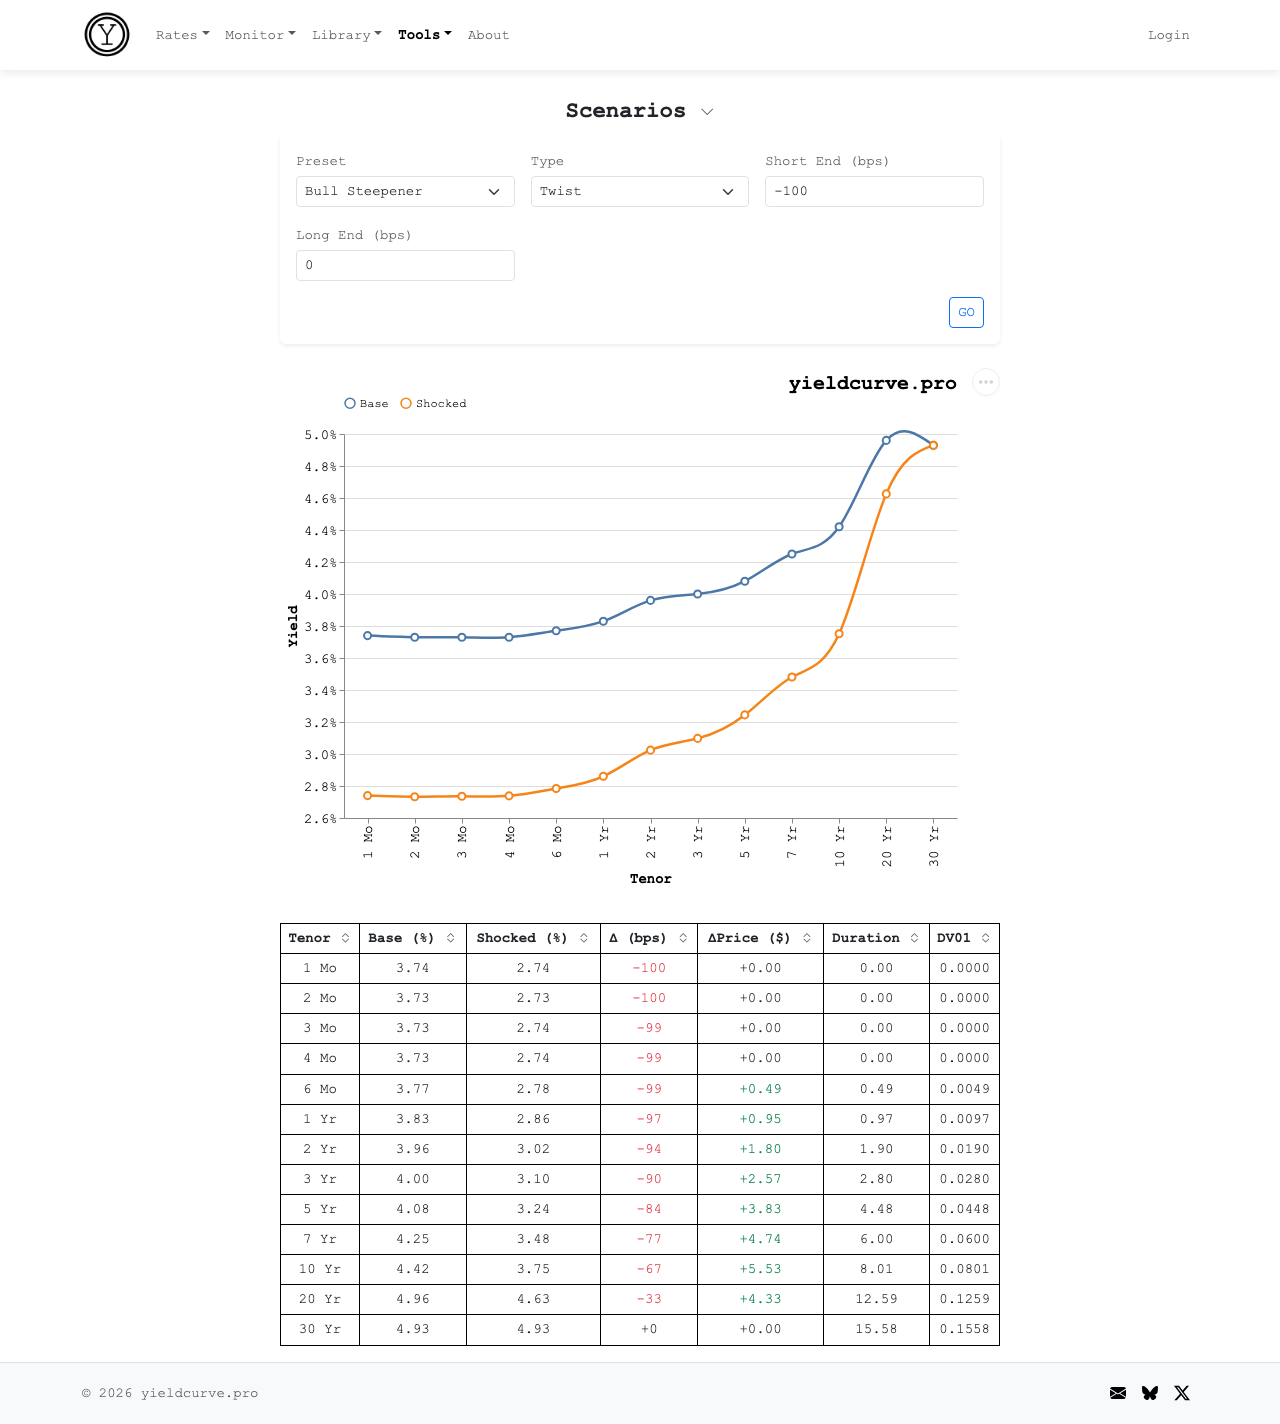
*Figure 4: Bull Steepener scenario — front end drops 100 bps, long end unchanged. The trade the consensus was positioned for.*
Try the scenario simulator on yieldcurve.pro
Walk through each leg of the DV01-neutral position:
- **2 Yr (long)**: yield falls 94 bps (3.96% → 3.02%), price gains +\$1.80 per \$100 face. You own this — it's your profit.
- **10 Yr (short)**: yield falls 67 bps (4.42% → 3.75%), price gains +\$5.53 per \$100 face. You're short — this price rise is your loss.
On the DV01-neutral position: long leg gain = 4.24 × \$1.80 = +\$7.63. Short leg loss = −\$5.53. Net: **+\$2.10**, or +40 bps on \$524 of capital. The steepener profits, but \$2.10 on \$524 of face deployed — for a scenario requiring 100 bps of Fed cuts with a perfectly anchored long end — is a thin reward for a specific bet.
## Step 5: What the Trade Got
Instead: a bear flattener. Both ends sold off. The 2-year harder than the 10-year. Fourteen of nineteen Fed participants now see zero or one cut in 2026. The longer-run neutral rate ticked up to 3.1%. Powell called it "the high end of neutral." The engine the steepener needed — aggressive cutting — is priced out.
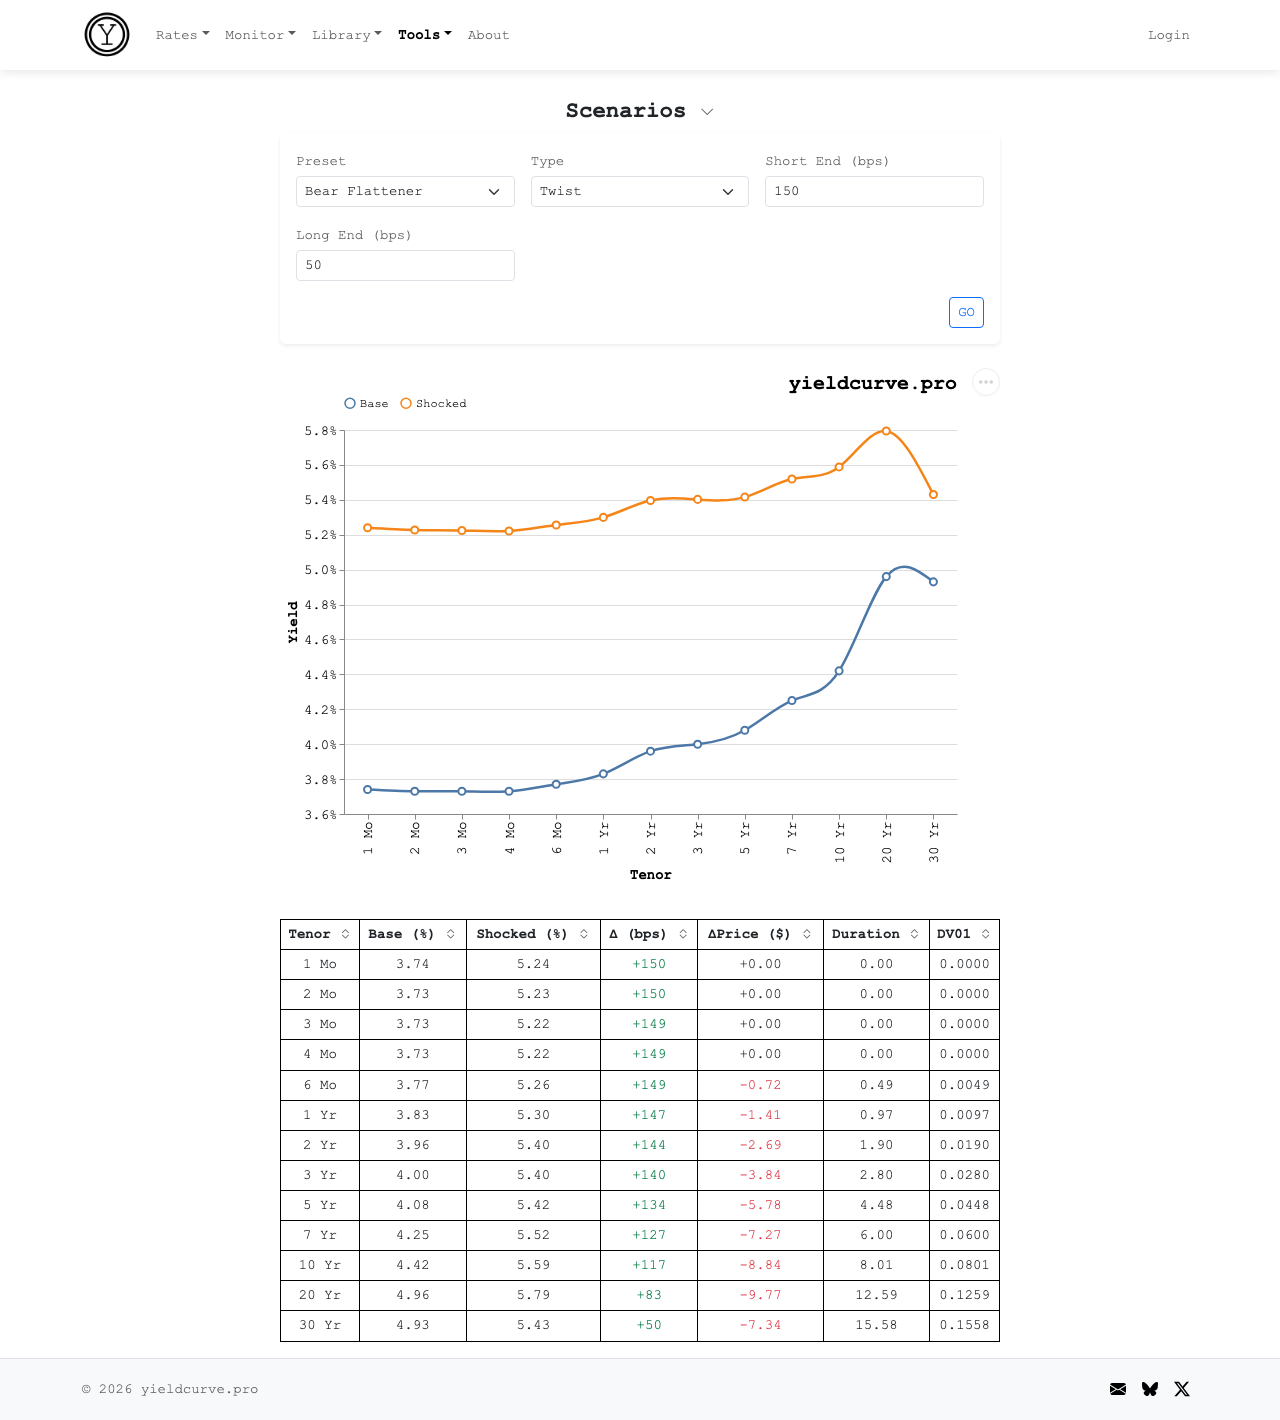
*Figure 5: Bear Flattener — short rates +150 bps, long rates +50 bps. What the market delivered.*
Try the scenario simulator on yieldcurve.pro
Each leg:
- **2 Yr (long)**: yield rises 144 bps (3.96% → 5.40%), price drops −\$2.69. You own this — it's your loss.
- **10 Yr (short)**: yield rises 117 bps (4.42% → 5.59%), price drops −\$8.84. You're short — this price drop is your gain.
On the DV01-neutral position: long leg loss = 4.24 × (−\$2.69) = −\$11.41. Short leg gain = +\$8.84. Net: **−\$2.57**, or −49 bps on \$524 of capital. The spread compressed and you lost money. The DV01 hedge absorbed the parallel component of the selloff — without it, the directional losses would have been far worse — but it couldn't protect against the twist.
## The Alternative
Lourie offers three alternatives. The simplest: own the 5-year outright.
The rolldown calculator shows the 5 Yr earns +35 bps of carry and +20 bps of rolldown for +54 bps total — three times the steepener's +18 bps, with none of the structural complexity. If the Fed does cut, the scenario simulator shows the 5-year gaining +\$3.83 per \$100 face on a −100 bps shift. No DV01 matching. No 4x capital. No spread construction.
One caveat. Over the January-to-March bear market, the 5-year outright lost *more* than the steepener — roughly −219 bps on capital, vs the steepener's −40 bps. The 5Y yield rose +51 bps and the directional position ate the entire move. The steepener's DV01 hedge protected against the parallel selloff.
The 5-year is the better trade if cuts arrive. It is not unconditionally better. It depends on whether you're positioning for a level move or a shape move — and whether you're willing to take directional risk to express it.
The 2s10s steepener is a compelling narrative about curve normalization. As a trade, its structural handicap — 4x capital, thin carry, vulnerability to any flattening — means the thesis has to be overwhelmingly right just to break even. Lourie has said this three times. The duration, rolldown, and scenario calculators let you check the math yourself.
## FAQ
### Why does a 2s10s steepener require 4x more capital than a directional Treasury position?
A DV01-neutral 2s10s steepener requires long-2-year and short-10-year positions sized so each leg moves the same dollar amount per basis point. Since the 2-year has roughly one-quarter the DV01 of the 10-year, the long 2-year leg must be roughly 4x the face value of the short 10-year leg. The trade thus consumes 4x the gross notional of a single-tenor position.
### What is a bear flattener and why does it kill a 2s10s steepener?
A bear flattener is a curve move where short-end yields rise more than long-end yields, flattening the curve while overall rates rise. A 2s10s steepener loses on both legs in this regime: the long 2-year falls in price, the short 10-year falls less, and the spread narrows against the trade. The position can lose money even in a parallel-up move depending on hedge construction.
### How is the DV01 hedge ratio for a 2s10s steepener computed?
The hedge ratio is $\text{ratio} = \text{DV01}_{10Y} / \text{DV01}_{2Y}$. Since a typical 10-year par bond has roughly 4.5× the DV01 of a 2-year par bond, you need approximately 4.5 notional dollars of 2-year for every notional dollar of 10-year to neutralize parallel-shift risk.
### Is the carry on a 2s10s steepener typically large enough to offset the trade's risk?
No. The post documents +18 bps per year of carry on the DV01-neutral position, which is small relative to the trade's volatility. A 5-year outright position generates roughly three times that carry plus meaningful rolldown, without DV01 matching or 4x capital. Steepeners trade for shape conviction, not income.