# Annual Fixed-Income Performance
Source: https://www.yieldcurve.pro/blog/annual-bond-perf-001
Published: 2024-06-07
Tags: AGG, Bonds, Credit, ETFs, Fixed-Income, HYG, IEF, IEI, Investment Grade, LQD, Rates, SHV, SHY, TLH, TLT, Treasury Bonds, noindex
_Examining How Different Bond ETFs Have Performed Historically_
# Examining How Different Bond ETFs Have Performed Historically
We are about midway through 2024 and we wanted to pause and take a quick
look at how different bond ETFs are performing year-to-date (YTD). In
addition, we wanted to compare that to how the different categories of
fixed-income have measured up historically.
One simple way to do that is to create a tapestry chart like the one
shown in Figure 1.
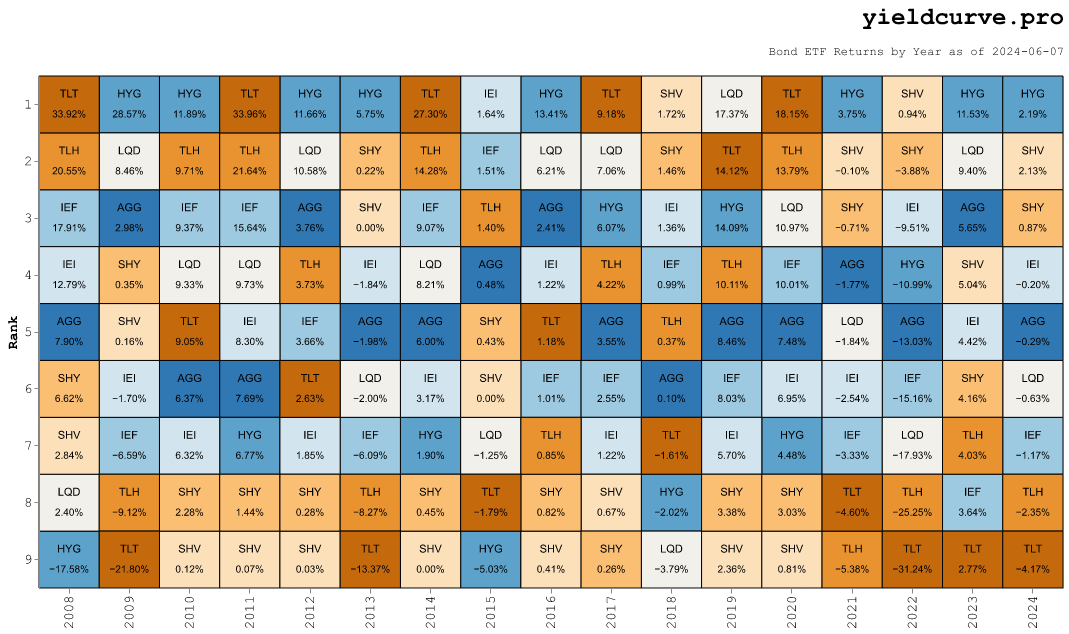 #### **Figure 1**: Bond ETF Historical Performane by Year
Each color coded tile on the chart represents one of the bond ETFs shown in Table 1.
| Ticker | Description |
|:---------|:-----------------------------------|
| SHV | Short Treasury |
| SHY | 1-3 Year Treasury |
| IEI | 3-7 Year Treasury |
| IEF | 7-10 Year Treasury |
| TLH | 10-20 Year Treasury |
| TLT | 20+ Year Treasury |
| AGG | Core U.S. Aggregate |
| HYG | iBoxx $ High Yield Corporate |
| LQD | iBoxx $ Investment Grade Corporate |
#### **Table 1**: iShares Bond ETFs
Each tile in Figure 1 shows the ticker with the corresponding annualized return
in percent just below. Each year, the tiles are ordered from the best to worst
performing category from top (best) to bottom (worst).
The right most column reports 2024 YTD returns. Excluding this year, it is
interesting to note that **HYG** and **TLT** have occupied the top spot 12 out
of 16 times with each holding that position 6 times.
Long dated rates (i.e., **IEF**, **TLH**, **TLT**) have had terrible
performance the last 4 years with **TLT** occupying the bottom spot the
majority of the time. 2022 was the worst year for rates with tenors exceeding
one year in decades with each ETF performing monotonically worse with
increasing duration.
As we know Treasury Bills (**SHV**) and short-dated Notes (**SHY**) have
performed well recently as have High Yield bonds (**HYG**).
We plan to update this chart on a quarterly basis so stay tuned.