# Are Bitcoin ETF Managers Doing A Good Job (Part 1)?
Source: https://www.yieldcurve.pro/blog/btc-etf-tracking-error-001
Published: 2024-03-25
Tags: ARK, ARKB, BITB, BRRR, BTCO, BTCW, Beta, Bitcoin, Bitwise, Drawdown, ETFs, EZBC, FBTC, Fidelity, Franklin Templeton, GBTC, Grayscale, HODL, IBIT, Invesco, Tracking Error, Valkyrie, VanEck, WisdomTree, iShares
_Taking a look at how closely the new ETFs track Bitcoin_
# Are Bitcoin ETF Managers Doing A Good Job?
Early in our career, we were responsible for managing a variety of different
equity index funds. If you were doing your job correctly, investors in those
funds could expect to enjoy single digit tracking errors.
Tracking error is simply the annualized standard deviation of the difference in
daily returns between two different assets **1** and **2**:
$$TE = \sqrt{\frac{252}{N-1} \sum_{i=1}^{N} (R_{1,i} - R_{2,i})^2 }$$
Obviously, the smaller the tracking error the tighter asset 1 tracks
asset 2. A tracking error of zero implies perfect replication of returns.
Recently, a number of institutional asset managers have launched a set of
exchange-traded funds (ETFs) designed to track the Bitcoin crypto currency. It
is natural to wonder how those ETFs are tracking as a group. Moreover, we are
curious to know which of them does the best job.
# Grayscale Bitcoin Trust
One of these ETFs did not begin that way. More specifically, the Grayscale
Bitcoin Trust ETF was originally launched as a trust in 2013 and offered to
accredited investors only. In 2015, it became a publicly ***quoted***
instrument.
Grayscale first attempted to convert the trust to an ETF in 2017, a process that
concluded on January 10, 2024 with approval for GBTC as well as for the
following set of managers:
| Ticker | Manager | AUM ($M) | Fee (BPS) |
| :----- | :------ | ------ : | ------- : |
| GBTC | Grayscale | $23,372 | 150 |
| IBIT | iShares | $15,681 | 25 |
| FBTC | Fidelity | $8,891 | 25 |
| ARKB | ARK | $2,633 | 21 |
| BITB | Bitwise | $1,956 | 20 |
| HODL | VanEck | $514 | 20 |
| BRRR | Valkyrie | $423 | 25 |
| BTCO | Invesco | $328 | 25 |
| EZBC | Franklin Templeton | $236 | 19 |
| BTCW | WisdomTree | $74 | 25 |
#### **Table 1**: Bitcoin ETFs, Managers, AUM, and Fee
GBTC has the distinction of being the oldest, largest, and most expensive
Bitcoin index ETF. Since it has the longest history we will use it to compute
a longer, rolling history of tracking error. We will then look at some of the
other funds and their performance since inception.
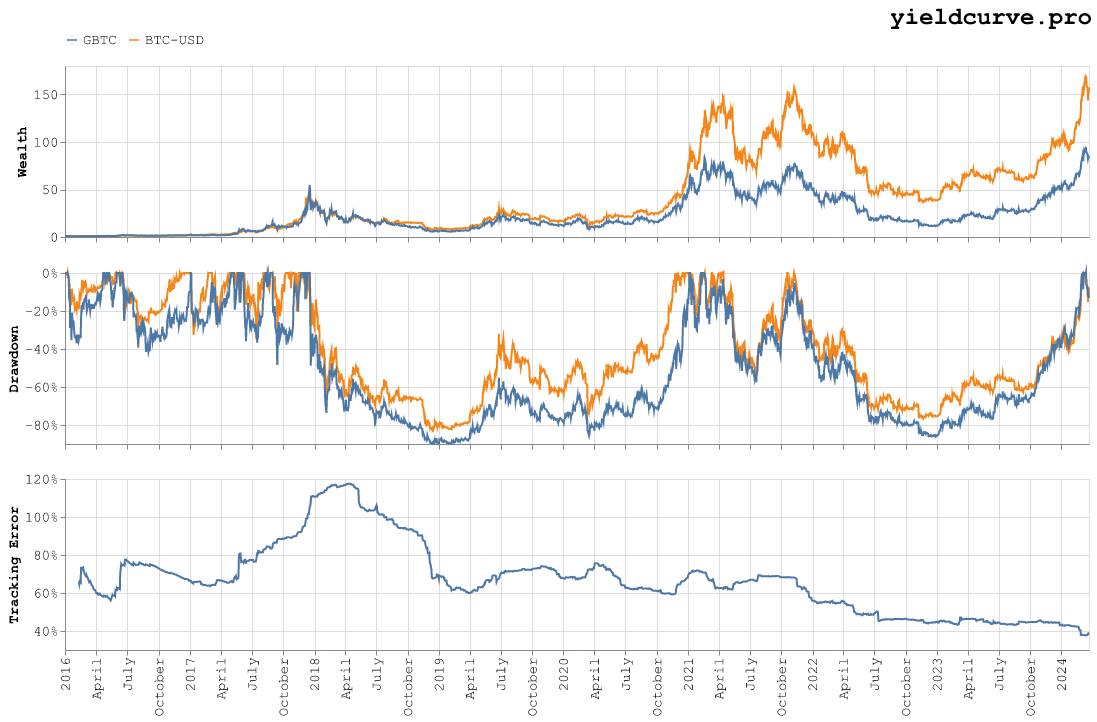
#### **Figure 1**: Wealth, Drawdown, and Relative Tracking Error (BTC-USD and GBTC)
It is apparent from the equity curves that GBTC has dramatically underperformed
spot. Table 2 shows the average annualized returns for each.
| Symbol | Arithmetic | Geometric |
|:---------|-------------:|------------:|
| BTC-USD | 83.16% | 80.91% |
| GBTC | 88.93% | 67.81% |
#### **Table 2**: Average Annualized Returns (2016 to Present)
Interestingly, GBTC had higher/lower arithmetic/geometric returns,
respectively.
As shown in Table 3, GBTC had larger average and maximum drawdowns.
| Symbol | Average | Maximum |
|:---------|----------:|----------:|
| BTC-USD | 39.57% | 83.01% |
| GBTC | 50.69% | 89.91% |
#### **Table 3**: Drawdowns (2016 to Present)
Turning our attention to rolling annualized tracking error, we see it increase
from about 60% at inception to a maximum value of 117% in early 2018. While
not monotonic, tracking error continues to decrease settling at a terminal
value of about 39%. These values are summarized by Table 4.
| Symbol | Minimum | Average | Maximum | Terminal |
|:---------|----------:|----------:|----------:|-----------:|
| GBTC | 37.67% | 67.19% | 117.55% | 39.15% |
#### **Table 4**: Tracking Error (2016 to Present)
As a manager, it appears that Grayscale has improved over time with a
noticeable inception-to-present reduction in tracking error.
# Other Managers
In order to arrive at an apples-to-apples comparison we are going to compute
tracking error for GBTC and the new ETFs in the same fashion. We will assume
that GBTC launches on the same day and compute rolling annualized tracking
errors using a minimum of 30 days of data.
Figure 2 shows the Wealth, Drawdown, and Tracking Error charts for spot and
each ETF listed in Table 1.
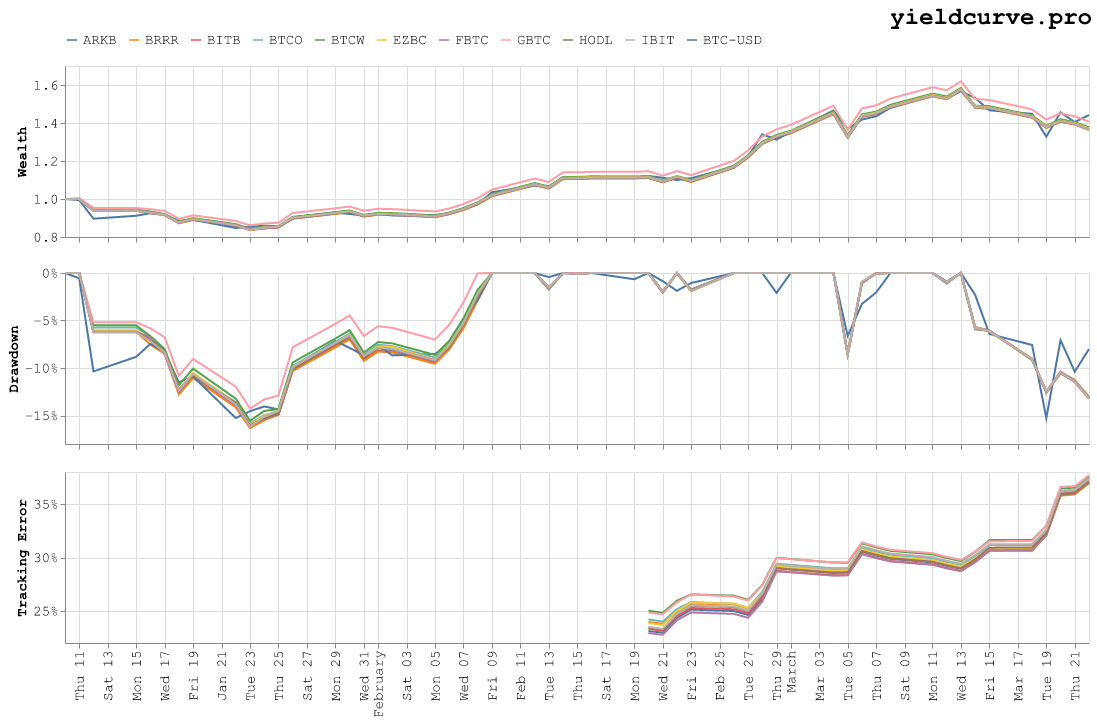
#### **Figure 2**: Wealth, Drawdown, and Relative Tracking Error (BTC-USD and ETFs)
The equity curves for the ETFs seem to track each other fairly well. However,
the reader should notice that spot and GBTC are trading at a premium relative
to the other managers. Table 5 shows the average annualized returns since
launch.
| Symbol | Arithmetic | Geometric |
|:---------|-------------:|------------:|
| BTC-USD | 192.85% | 469.82% |
| ARKB | 164.46% | 344.73% |
| BITB | 162.78% | 337.73% |
| BRRR | 163.30% | 338.96% |
| BTCO | 166.51% | 354.60% |
| BTCW | 167.21% | 357.37% |
| EZBC | 165.56% | 349.71% |
| FBTC | 164.15% | 343.14% |
| GBTC | 177.24% | 407.19% |
| HODL | 164.19% | 342.95% |
| IBIT | 164.05% | 342.51% |
#### **Table 5**: Average Annualized Returns (January 10, 2024 to Present)
The difference between arithmetic and geometric is so pronounced it makes us
wonder if there is any point in reporting the latter.
Table 6 reports drawdowns for each asset.
| Symbol | Average | Maximum |
|:---------|----------:|----------:|
| BTC-USD | 5.03% | 15.28% |
| ARKB | 5.10% | 16.12% |
| BITB | 5.15% | 16.25% |
| BRRR | 5.18% | 16.33% |
| BTCO | 4.95% | 15.82% |
| BTCW | 4.86% | 15.56% |
| EZBC | 5.03% | 15.93% |
| FBTC | 5.09% | 16.00% |
| GBTC | 4.36% | 14.28% |
| HODL | 5.09% | 16.08% |
| IBIT | 5.06% | 16.18% |
#### **Table 6**: Drawdowns (January 10, 2024 to Present)
Spot and GBTC display the best drawdown characteristics.
Tracking errors (since inception) are shown in Table 7.
| Symbol | Minimum | Average | Maximum | Terminal |
|:---------|----------:|----------:|----------:|-----------:|
| ARKB | 22.97% | 29.05% | 36.98% | 36.98% |
| BITB | 23.14% | 28.97% | 36.98% | 36.98% |
| BRRR | 23.79% | 29.24% | 36.97% | 36.97% |
| BTCO | 24.00% | 29.53% | 37.28% | 37.28% |
| BTCW | 24.82% | 30.05% | 37.56% | 37.56% |
| EZBC | 23.69% | 29.35% | 37.24% | 37.24% |
| FBTC | 22.77% | 28.87% | 37.16% | 37.16% |
| GBTC | 24.68% | 30.06% | 37.69% | 37.69% |
| HODL | 23.26% | 29.18% | 37.07% | 37.07% |
| IBIT | 23.32% | 29.46% | 37.38% | 37.38% |
#### **Table 7**: Tracking Error (January 10, 2024 to Present)
Fidelity (FBTC) has the lowest average while Valkyrie (BRRR) has the lowest
terminal tracking error, respectively. It is intereseting to observe that,
since inception, tracking errors have increased steadily this year. Volatility
has been steadily ramping up so, as we will see, this is not too surprising.
# Discussion
We set out to try and assess if Bitcoin ETF managers are doing a good job.
Additionally, we were hoping to measure which of them was doing the best job.
Our measuring stick for determining this was tracking error. Visual inspection
of the equity, drawdown, and tracking error curves suggest our attempt to
measure manager efficiency has some problems:
- First, ETFs trade weekdays over a limited set of hours. As we all know Bitcoin
spot trades 24/7.
- Next, ETFs charge a management fee. We have listed these in Table 1 but have
made no attempt to adjust our calculations based on them.
- Last, unlike other traditional finance index products, managers in the crypto
space cannot rely on a market-on-close (MOC) auction to lock in consistent end
of day pricing. While it might make sense for them to transact at the
traditional TradFi MOC (to correspond with the ETF MOC) we have no intimate
knowledge of how or when these managers actually trade.
As far as we can tell the first two issues should not have material impact on
the tracking errors we see, simply based on their large magnitude. The last
one could make a significant difference, however.
Each manager tracking error is more-or-less the same magnitude. Because our
model is likely very imprecise we can't really say which is **best** or
**worst**. Instead, can we say they are all doing a **bad** job?
Since we are already conducting a noisy experiment there is nothing to stop us
from further muddying the analysis with some hand-wavy math. Let's start by
expressing tracking error using volatilities and correlation as follows:
$$TE^2 = \sigma_1^2 + \sigma_2^2 - 2 \sigma_1 \sigma_2 \rho$$
Let us say that:
$$\sigma_1 \approx \sigma_2 \approx \sigma$$
which, at least for an index product, isn't a horrible assumption. Actually,
it's a bit of stretch but here go. This simplifies tracking error a bit:
$$TE^2 = 2 \sigma^2 \left(1 - \rho\right)$$
Now, we want to compare tracking error for Bitcoin to an asset class we know
more about like equities. We can construct the following ratio:
$$\frac{TE_{BTC}}{TE_{SPY}} =
\frac{\sigma_{BTC} \sqrt{\left(1 - \rho_{BTC}\right)}}
{\sigma_{SPY} \sqrt{\left(1 - \rho_{SPY}\right)}}$$
This next assumption is likely a bad one but we won't let that stop us. We are
going to give our ETF managers the benefit of the doubt and say that the
different levels of tracking error are not due to differences in skill
relative to their equity manager brethren. This says that a given Bitcoin and
SPY ETF should have similar correlation with its index leading to:
$$TE_{BTC} \approx \frac{\sigma_{BTC}}{\sigma_{SPY}} TE_{SPY}$$
To a **very** rough approximation, an equally skilled Bitcoin index manager
should have a tracking error that is multiple of the equity counterpart where
the multiple is the ratio of their respective index volatilites.
At least this year, the ratio of volatilities has been approximately 5.6 so:
$$TE_{BTC} \approx 5.6 \times TE_{SPY}$$
As we said earlier, a skilled equity index fund manager can be expected to run
at a tracking error measured in the single digit basis point range. Even if we
increase the multiple in the above equation by an order of magnitude we will
not get anywhere near the values shown Table 7.
This most likely means one of two things:
- the Bitcoin ETF managers in Table 1 are God awful
- this hastily written analysis is total garbage
If it is the latter and/or you find some glaringly obvious mistakes in this
post, kindly shoot us a note. Moreover, anyone with intimate knowledge of how
these ETFs are managed please educate us. As we said, we know how it works on
the equity side but Bitcoin...not so much.
We have a
Feedback
page so please reach out.
Best -- YCP