# Is Gold a Stock-Bond Diversifier (Part 4)?
Source: https://www.yieldcurve.pro/blog/is-gold-a-diversifier-part-4
Published: 2026-02-04
Tags: AGG, Bonds, Correlation, Diversification, ETFs, GLD, Gold, IEF, IEI, Inflation, SHY, SPY, Stocks, TLH, TLT
_Does adding gold to traditional stock-bond portfolios provide diversification?_
# Does adding gold to traditional stock-bond portfolios provide diversification (Part 4)?
Gold has had an incredible run the last decade.
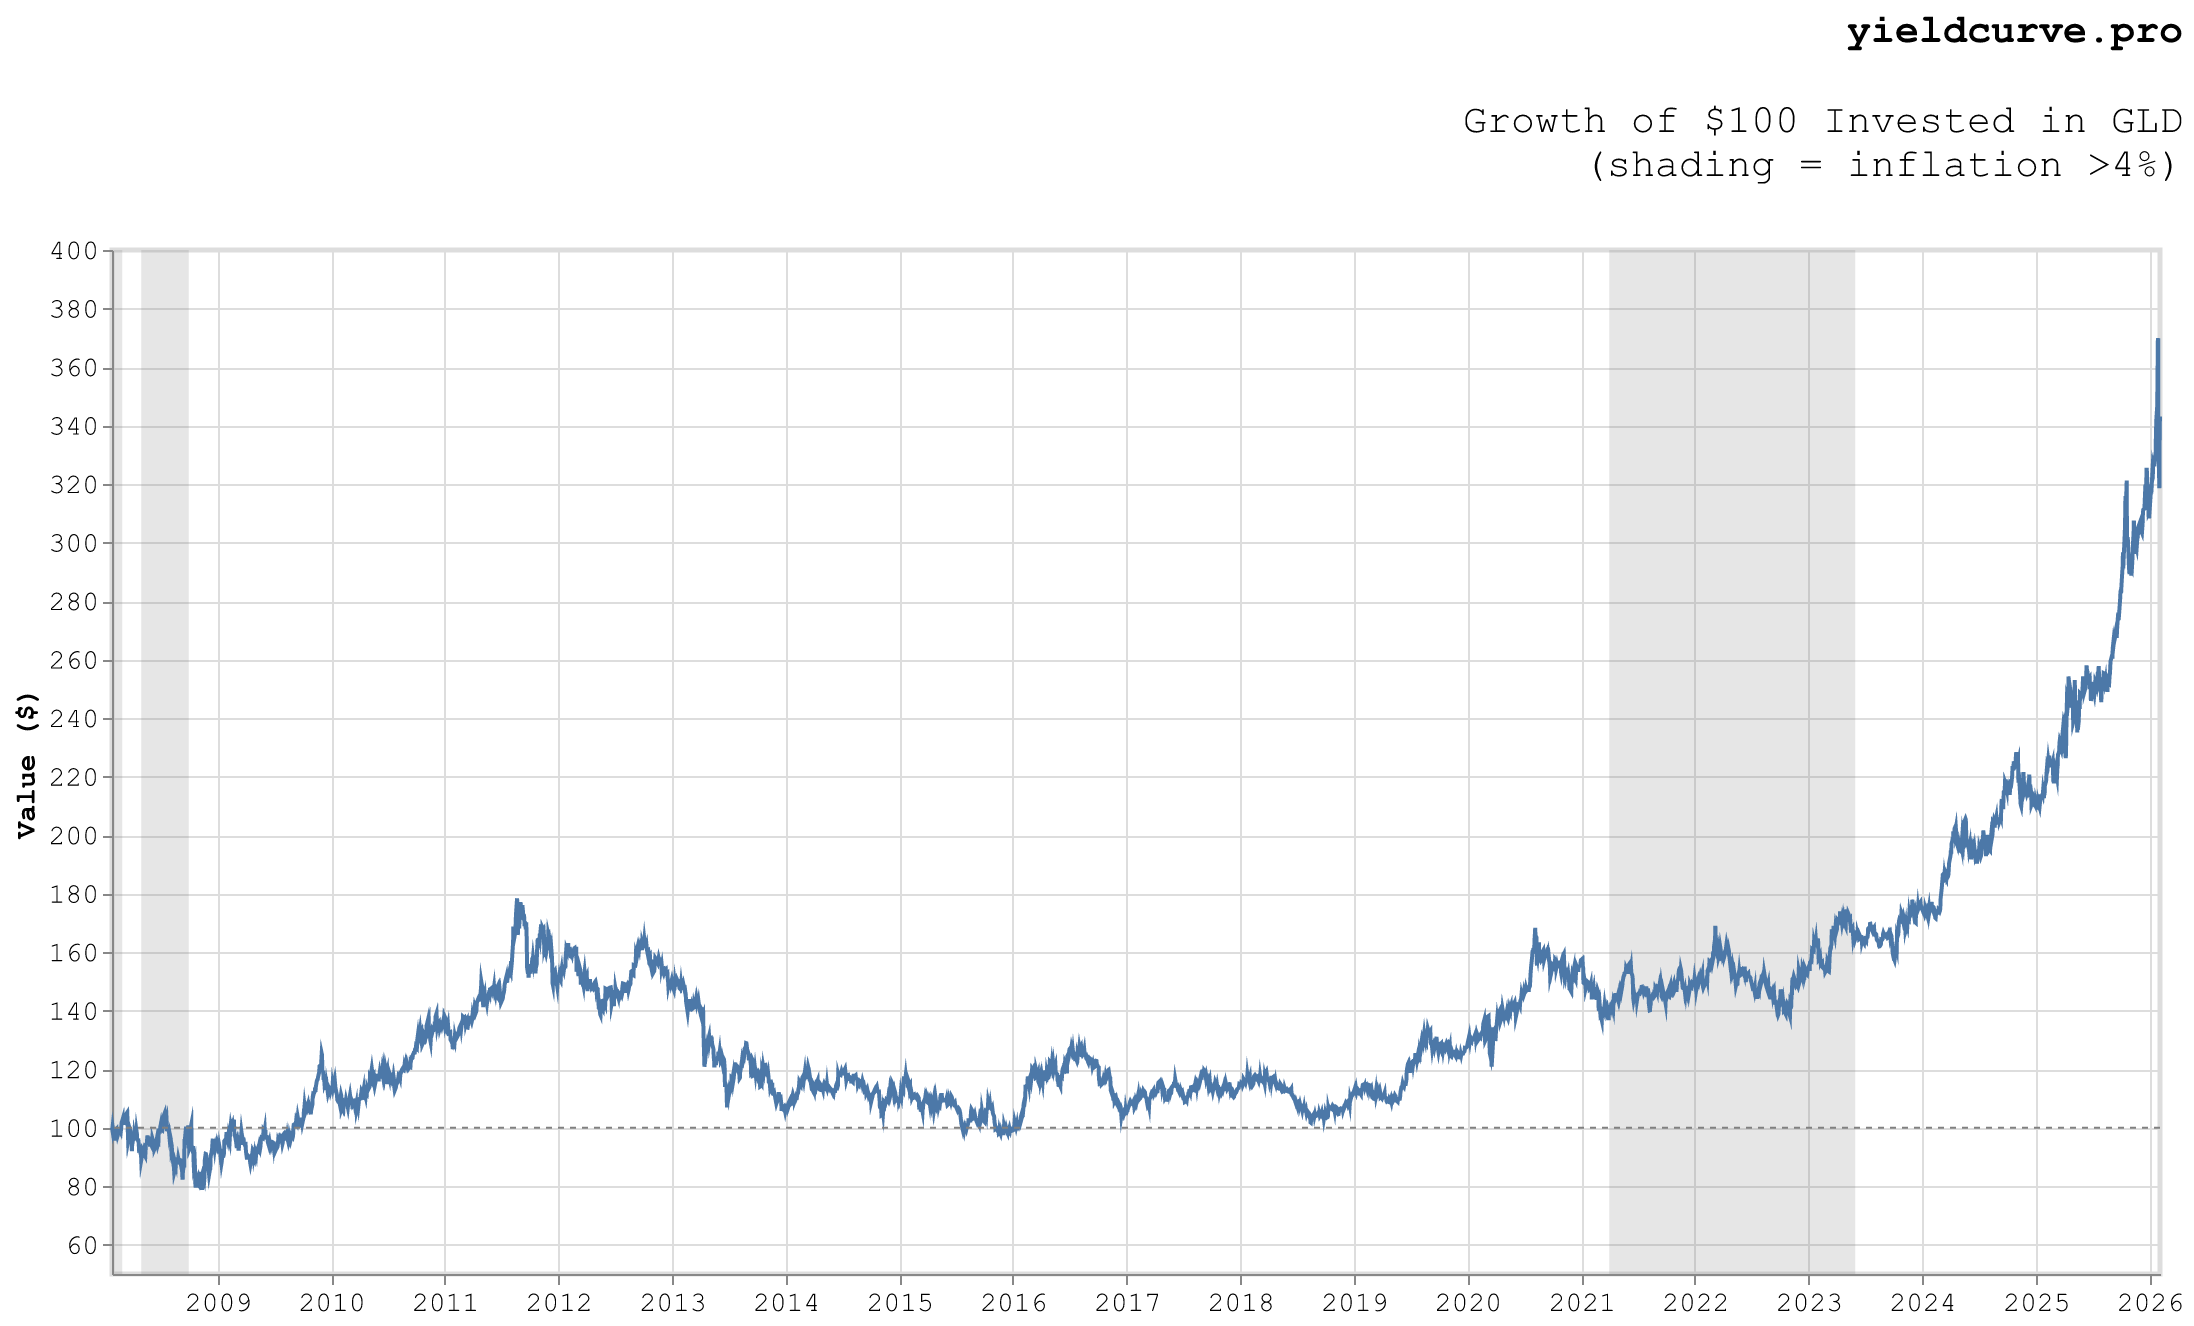
#### **Figure 1**: Cumulative Value of \$100 Invested in Gold (GLD)
One hundred dollars invested in the [GLD](https://www.spdrgoldshares.com/) ETF circa 2018
would be up over 3X today. Table 1 summarizes the performance statistics for the period
of data we are analyzing.
| Metric | Value |
| :--------------- | -----------------------: |
| Period | 2008-01-28 to 2026-02-04 |
| Total Return | 244.0% |
| CAGR | 7.4% |
| Volatility (Ann.)| 17.7% |
| Sharpe Ratio | 0.49 |
| Sortino Ratio | 0.69 |
| Max Drawdown | -45.4% |
| Calmar Ratio | 0.16 |
| Win Rate | 52.8% |
| Best Day | 11.3% |
| Worst Day | -10.3% |
#### **Table 1**: Gold (GLD) Performance Statistics
Interest has intensified lately due to chatter around
the *debasement trade* and the performance of other base and precious metals.
This reached a frenzy last week with President Trump's nomination of Kevin Warsh to
replace Jerome Powell as Chair of the Federal Reserve. This resulted in a sharp
downturn in both gold and silver prices. For GLD speficially, Figure 2 shows
drawdown as a function of time.
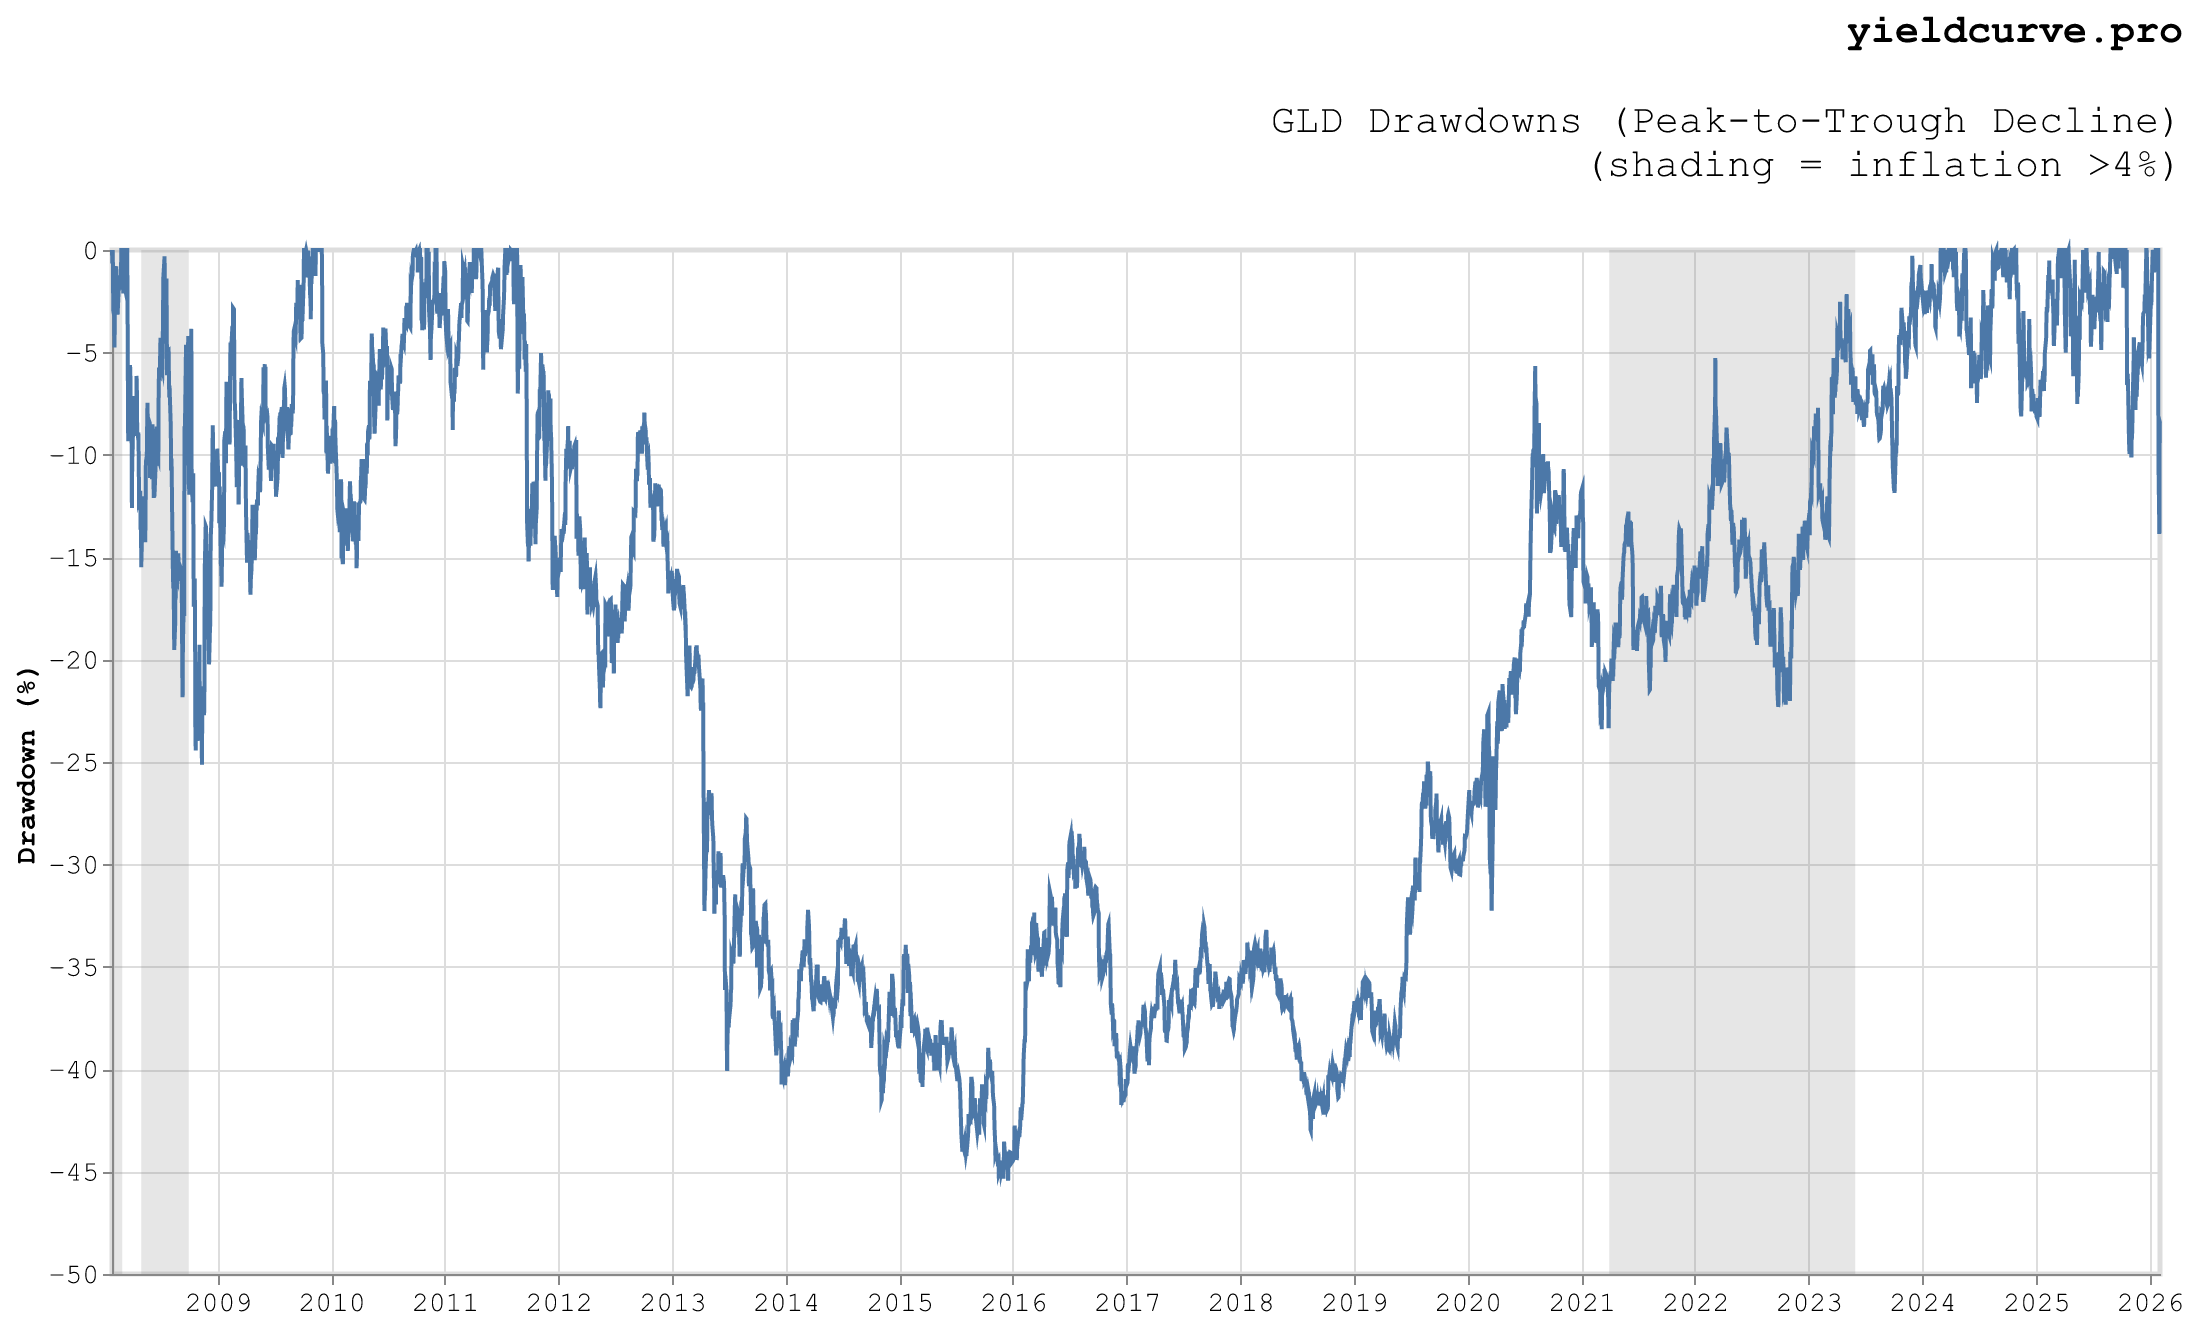
#### **Figure 2**: Drawdown for Gold (GLD)
The current drawdown of ~14% is substantial but, in the scheme of things, seems
relatively small compared to the maximum of 45.4% seen near the end of 2015.
While we still see a rationale for including gold (not silver so much) in a portfolio,
we thought this would be a good time to dust off an old study investigating the
diversification properties of the precious metal when added to a traditional stock-bond
portfolio.
In our previous posts (parts
one,
two, and
three),
we considered whether gold diversifies a classic portfolio of equities and
Treasuries. Those simple studies showed that gold can add diversification
to those types of portfolios.
Considering the same question posed in those studies, we examine the correlation
(computed in excess of the risk free rate) of gold with different bond and equity
ETFs show in Table 2.
| Ticker | Description | Asset Class |
| :------: | :--------------------- | :---------- |
| GLD | Gold | Gold |
| SHY | 1-3 Year Treasury | Bonds |
| IEI | 3-7 Year Treasury | Bonds |
| IEF | 7-10 Year Treasury | Bonds |
| TLH | 10-20 Year Treasury | Bonds |
| TLT | 20+ Year Treasury | Bonds |
| AGG | US Aggregate Bond | Bonds |
| SPY | S&P 500 | Stocks |
#### **Table 2**: ETF Proxies for Gold, Bonds, and Stocks.
In a departure from our previous blog posts we consider the US Aggregate Bond
ETF in addition to the usual set of rates ETFs. Also, we begin with viewing
the correlation scatter charts rather than beginning with the time series. We
want to add some information to the discussion informed by inflation and this
is probably the easiest way to accomplish that.
Figure 3 shows GLD's correlation with SPY (x-axis) versus its correlation with
each bond ETF (y-axis).
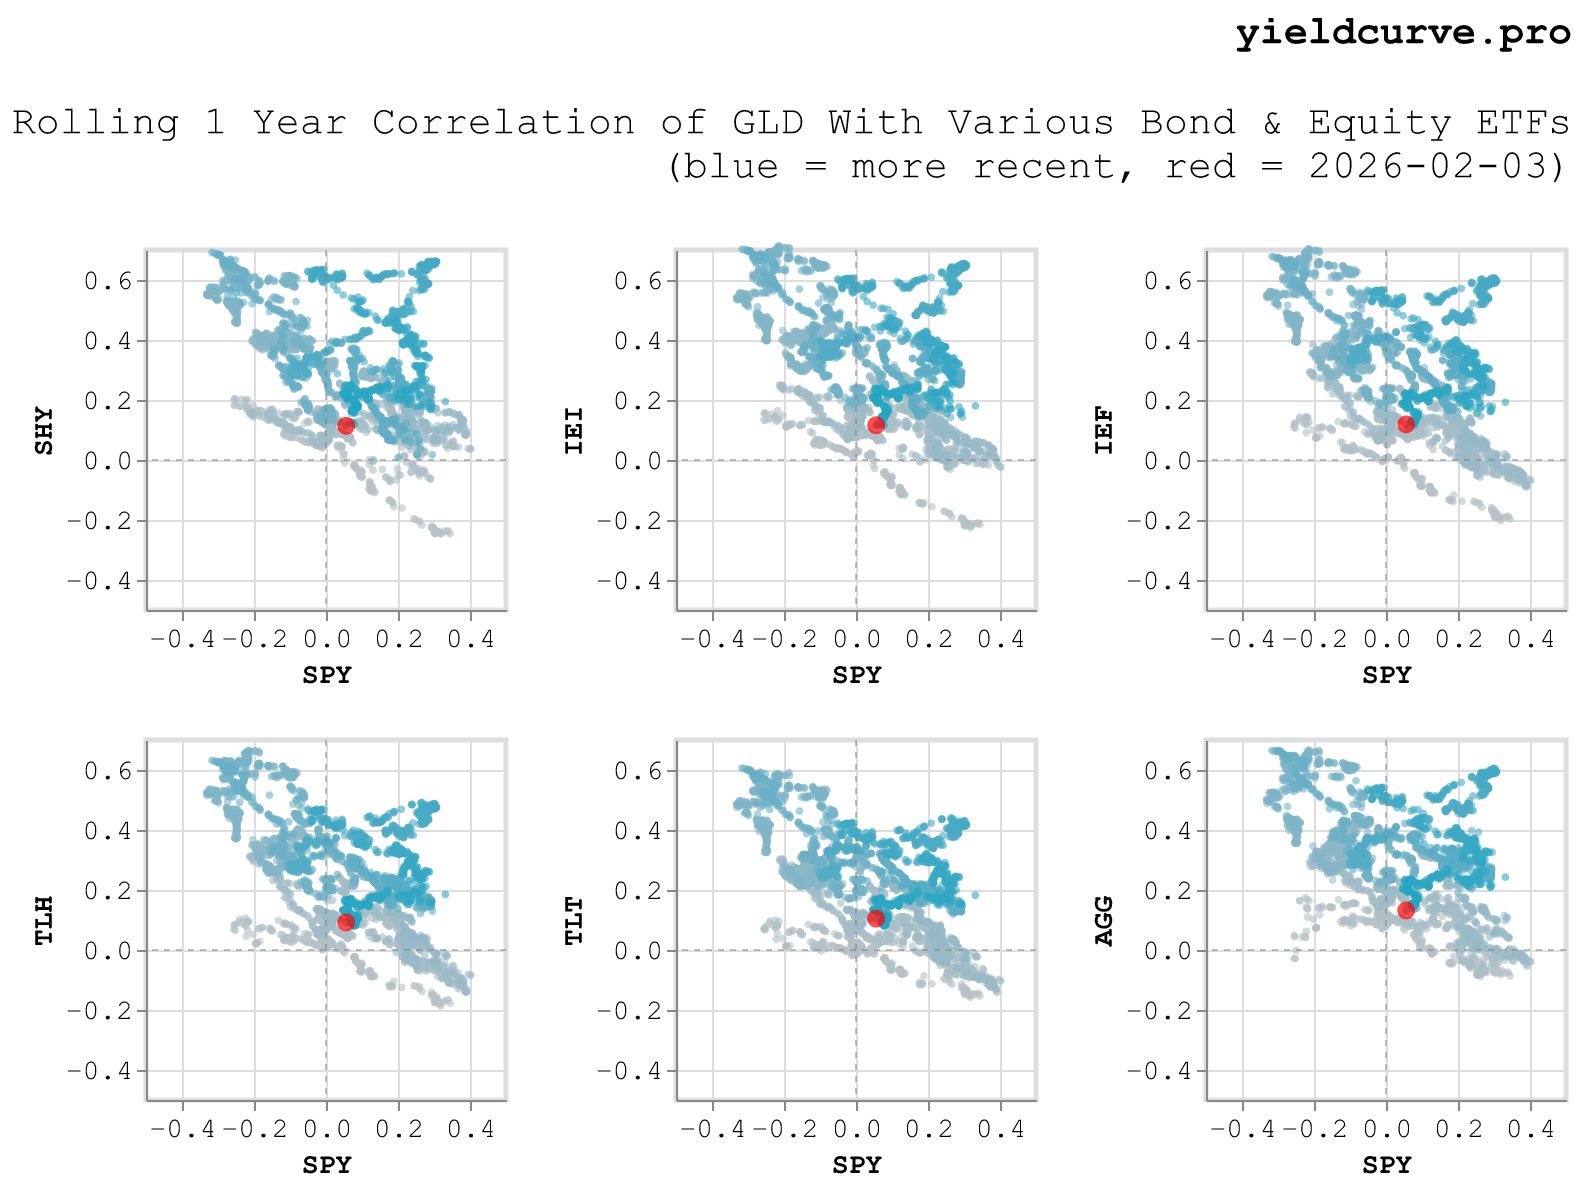
#### **Figure 3**: Compare GLD's Correlation With Stocks vs Bonds
The panels in Figure 3 are ordered by the increasing tenor of each rate ETF
considered. Also, the color of the symbols marking each point vary from
gray to blue depending on the point in time. Earlier points occur in gray
while later points in blue. Today's point is marked red.
Excluding many of the bluest points, it should be evident that GLD's
stock-bond correlation follows an negative linear relationship. Specifically,
as GLD's correlation with SPY increases, GLD's correlation with bonds decreases
and vice-versa.
However, there are some interesting deviations to this pattern. The upper
right-hand quadrants of each chart show a departure from the typical
linear pattern. These points correspond with dates beginning with the Pandemic
and continue for 1-2 years after (more on this later).
| Ticker | Mean | Std | Min | Max | % Negative | Current |
|:------:|------:|------:|-------:|------:|------------:|---------:|
| SPY | 0.04 | 0.17 | -0.33 | 0.40 | 42.09 | 0.06 |
| SHY | 0.29 | 0.19 | -0.25 | 0.69 | 2.93 | 0.11 |
| IEI | 0.31 | 0.20 | -0.23 | 0.71 | 3.37 | 0.12 |
| IEF | 0.29 | 0.19 | -0.20 | 0.70 | 7.14 | 0.12 |
| TLH | 0.25 | 0.18 | -0.19 | 0.66 | 7.72 | 0.09 |
| TLT | 0.22 | 0.17 | -0.16 | 0.61 | 9.50 | 0.10 |
| AGG | 0.29 | 0.18 | -0.09 | 0.67 | 5.27 | 0.13 |
#### **Table 3**: Correlation Statistics
Gold correlations with US rates and credit look essentially the same. They
are typically positive with means ranging from 0.22 to 0.31 and only exhibit
negative values between 2.93% and 9.50% of the time. In contrast, correlations
with stocks have a smaller mean (0.04) and are negative approximately an order
magnitude more often (42.09%). This means that gold adds more diversification
to pure equity portfolios relative to bond portfolios.
What explains the negative linear relationship and (more interestingly) the
recent deviations in it shown by Figure 3? The linear relationship should not
be a mystery. Over the period of data we are looking at (2008 -- present) stocks
and bonds have tended to be negatively correlated. By proxy, this is the
relationship captured in the scatter chart. But what explains the recent
deviations in the pattern?
Figure 4 rearranges the data in the scatter chart from Figure 3 and presents
them as time series. That is to say, it shows GLD's correlation with each
stock and bond ETF individually.
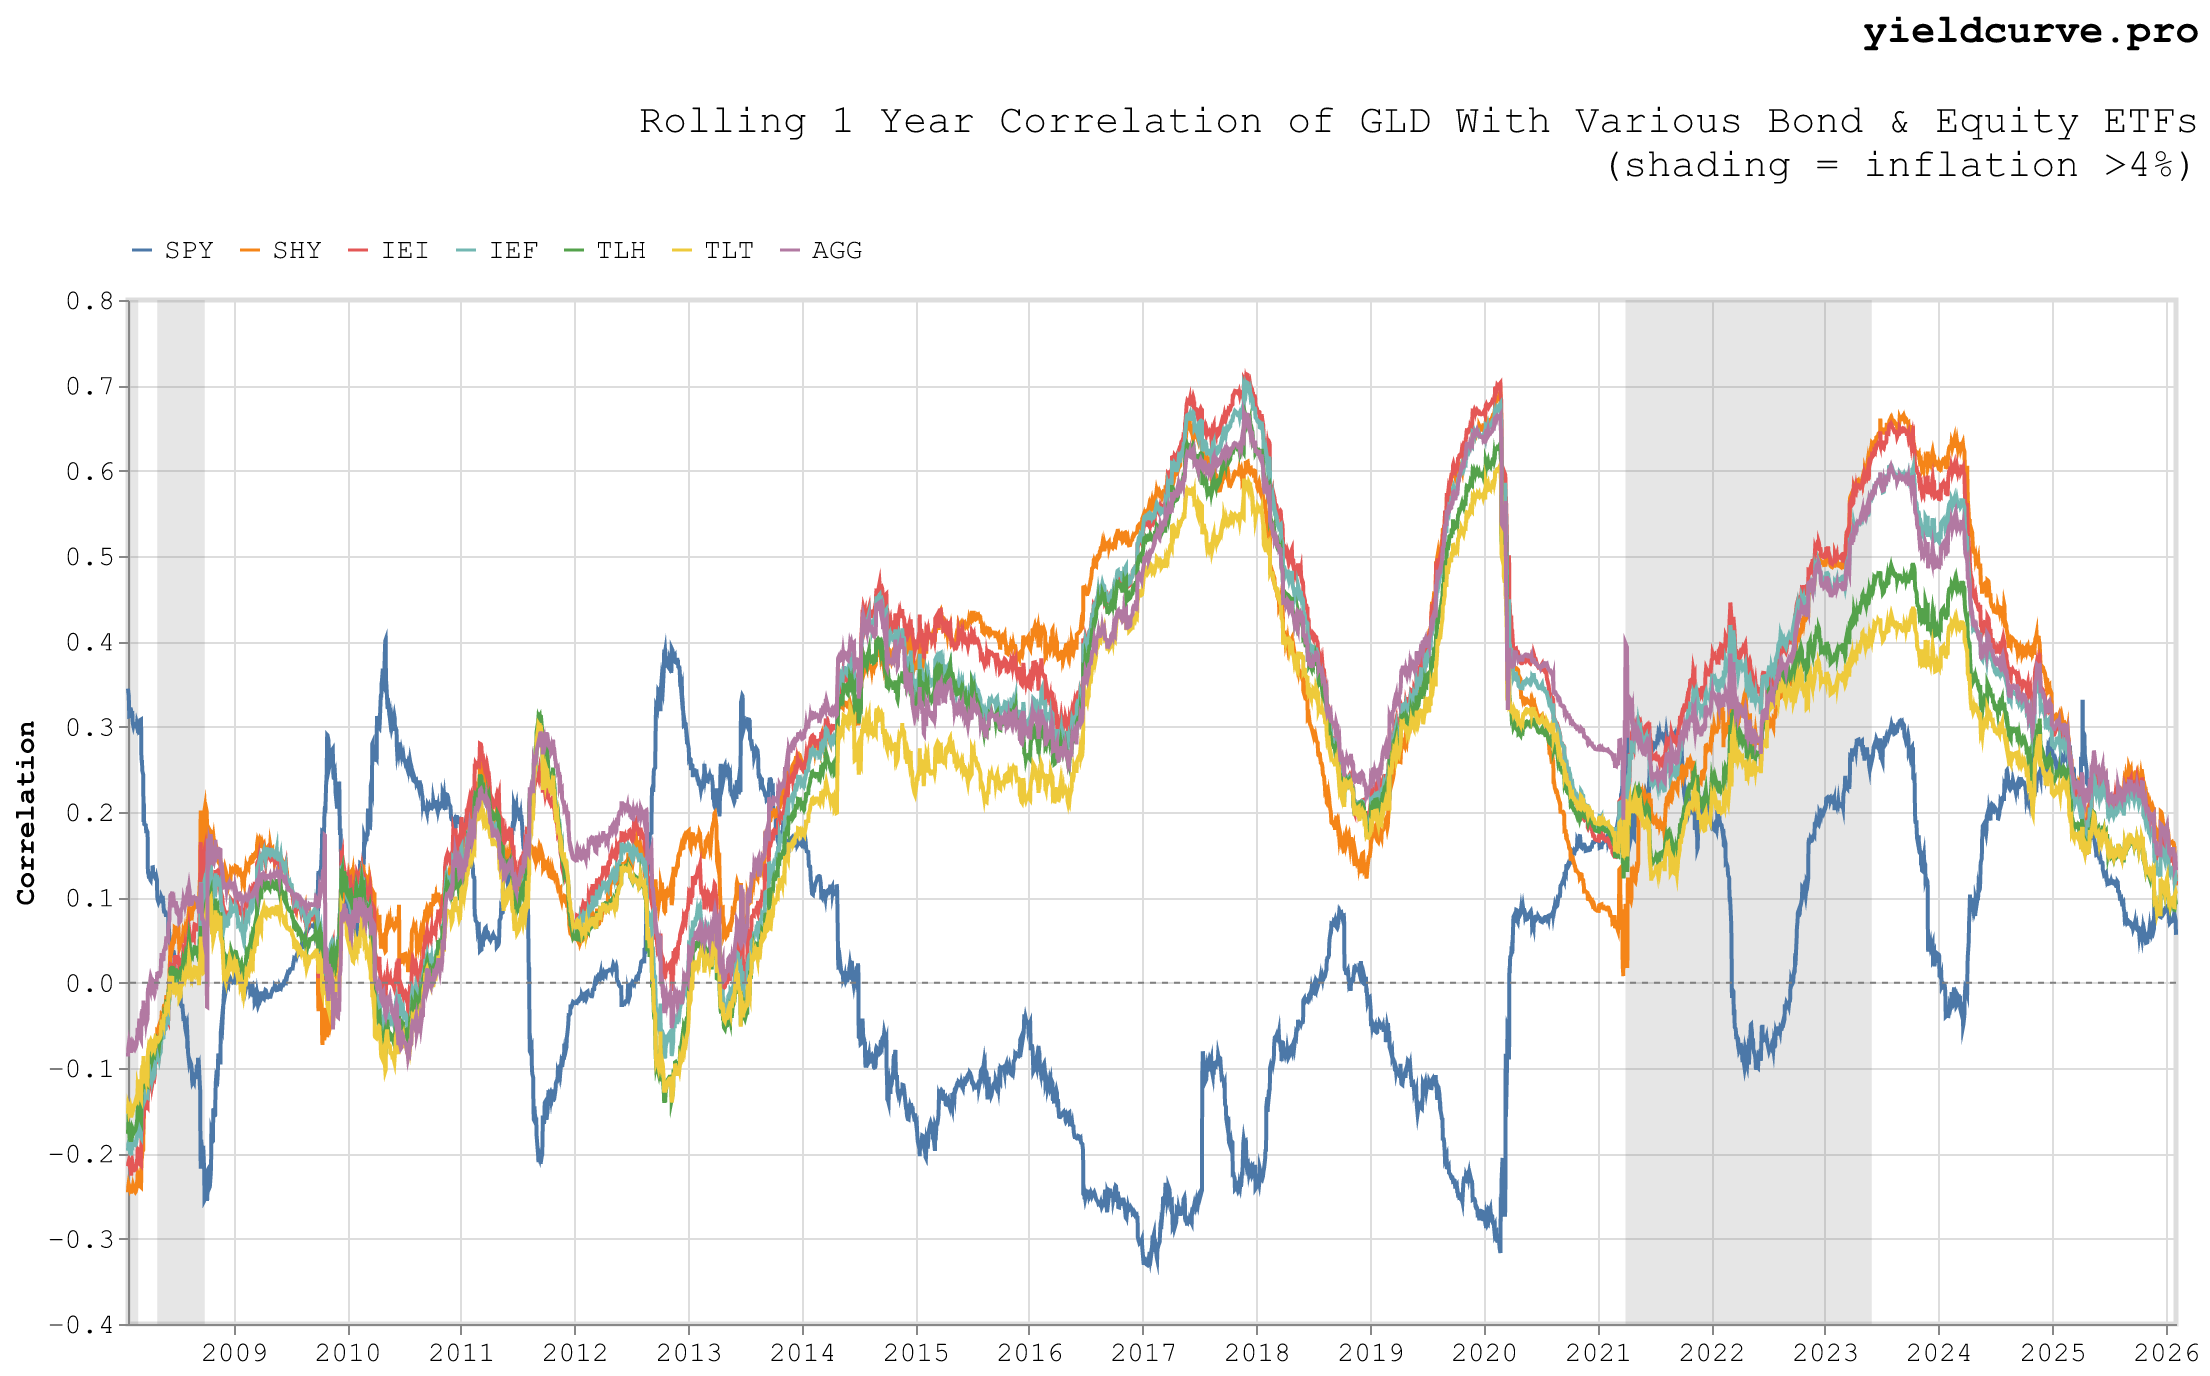
#### **Figure 4**: Rolling 1 Year Correlation of GLD With Various Bond & Equity ETFs
In addition to the correlation data, we superimposed epochs with elevated
inflation (larger than 4%) shaded in gray. GLD's correlation with stocks is highly
cyclical with a mean of 0.04. Not surprisingly, its correlation with bonds follows
the inverse pattern over time which is consistent with the negative linear relationship
in the scatter plots.
The interesting thing to notice is what happens to the time series during the periods
of elevated inflation experienced in the middle of the COVID pandemic. Sometime during
2023 we see the expected relationship breakdown.
To dig a bit deeper we will refer to a recent post
([An Update on the Stock-Bond Correlation](https://verdadcap.com/archive/an-update-on-the-stock-bond-correlation))
by Greg Obenshain of [Verdad Capital](https://verdadcap.com). In that write-up he
describes inflation's effect on the correlation between stocks and bonds.
In an environment when core inflation sits below a 4% threshold, growth dominates.
Weak growth pushes stocks down and bonds up (flight to safety plus expected Fed easing),
while strong growth does the reverse, producing the typical negative correlation
that makes 60-40 diversification effective.
When core inflation sits above 4%, inflation dominates. Stocks and bonds both
decline together as higher inflation raises bond yields and equity discount rates
simultaneously. Fed tightening further compresses growth expectations, producing
positive correlation.
These competing interactions are summarized by the chart produced by Verdad shown in Figure 5.
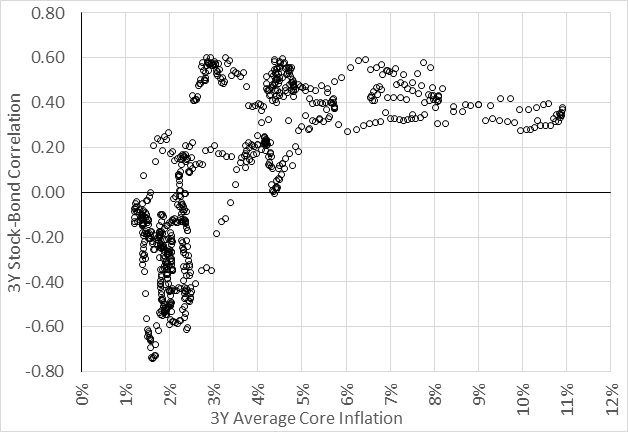
#### **Figure 5**: 3Y Trailing Monthly Stock-Bond Correlation vs. Avg. Core Inflation Rate over Same Period (Verdad)
For fun, we replicated Figure 5 using different look back windows. The results are shown
in Figure 6.
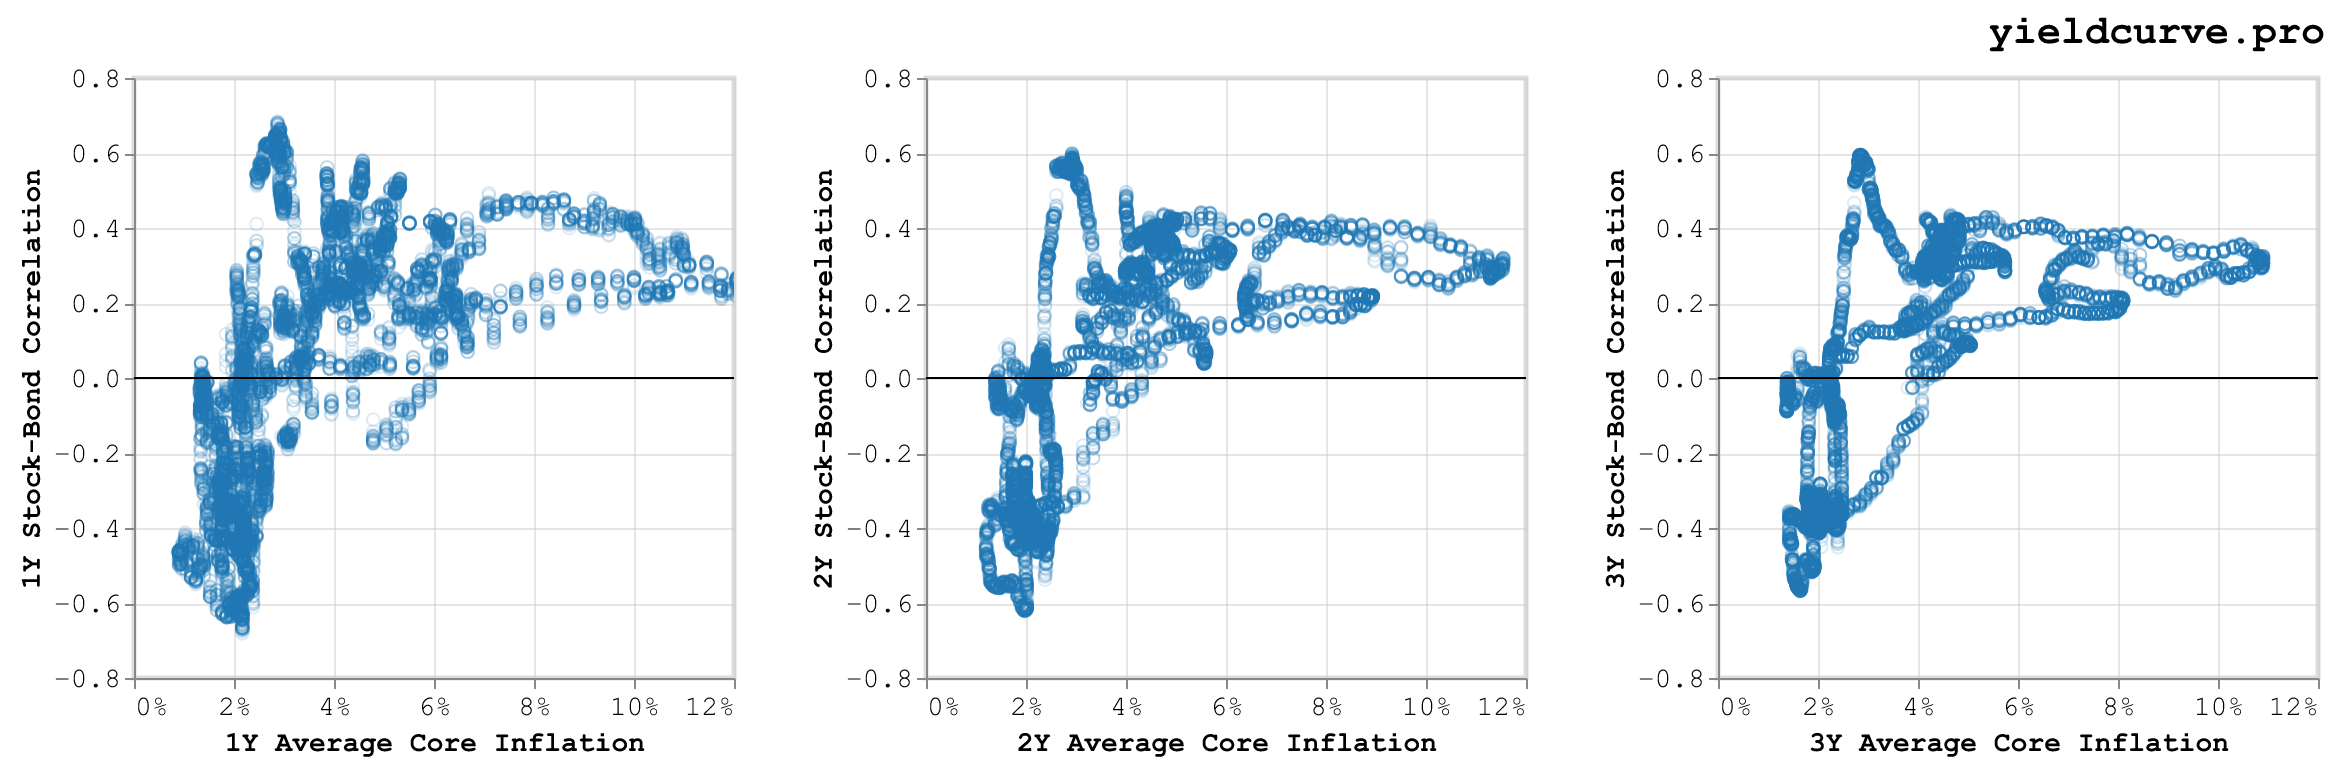
#### **Figure 6**: Trailing Monthly Stock-Bond Correlation vs. Avg. Core Inflation Rate over Same Period
The pattern holds consistently across 1, 2, and 3 year look backs.
So back to the original question posed at the beginning of the post: does adding gold to
traditional stock-bond portfolios provide diversification? Looking at where we
sit in correlation space (Figure 3) we believe the answer is YES. Correlations currently
sit as close to zero as we have ever seen in the limited dataset we are considering.
A related question is, given the recent drawdown from all time highs, is it still a good
time to allocate to GLD? Zooming in on the equity curve shown in Figure 1 and superimposing
the 200 day moving average onto the chart (consider this a poor man's trend following indicator)
suggests that GLD is still trending up (see Figure 7).
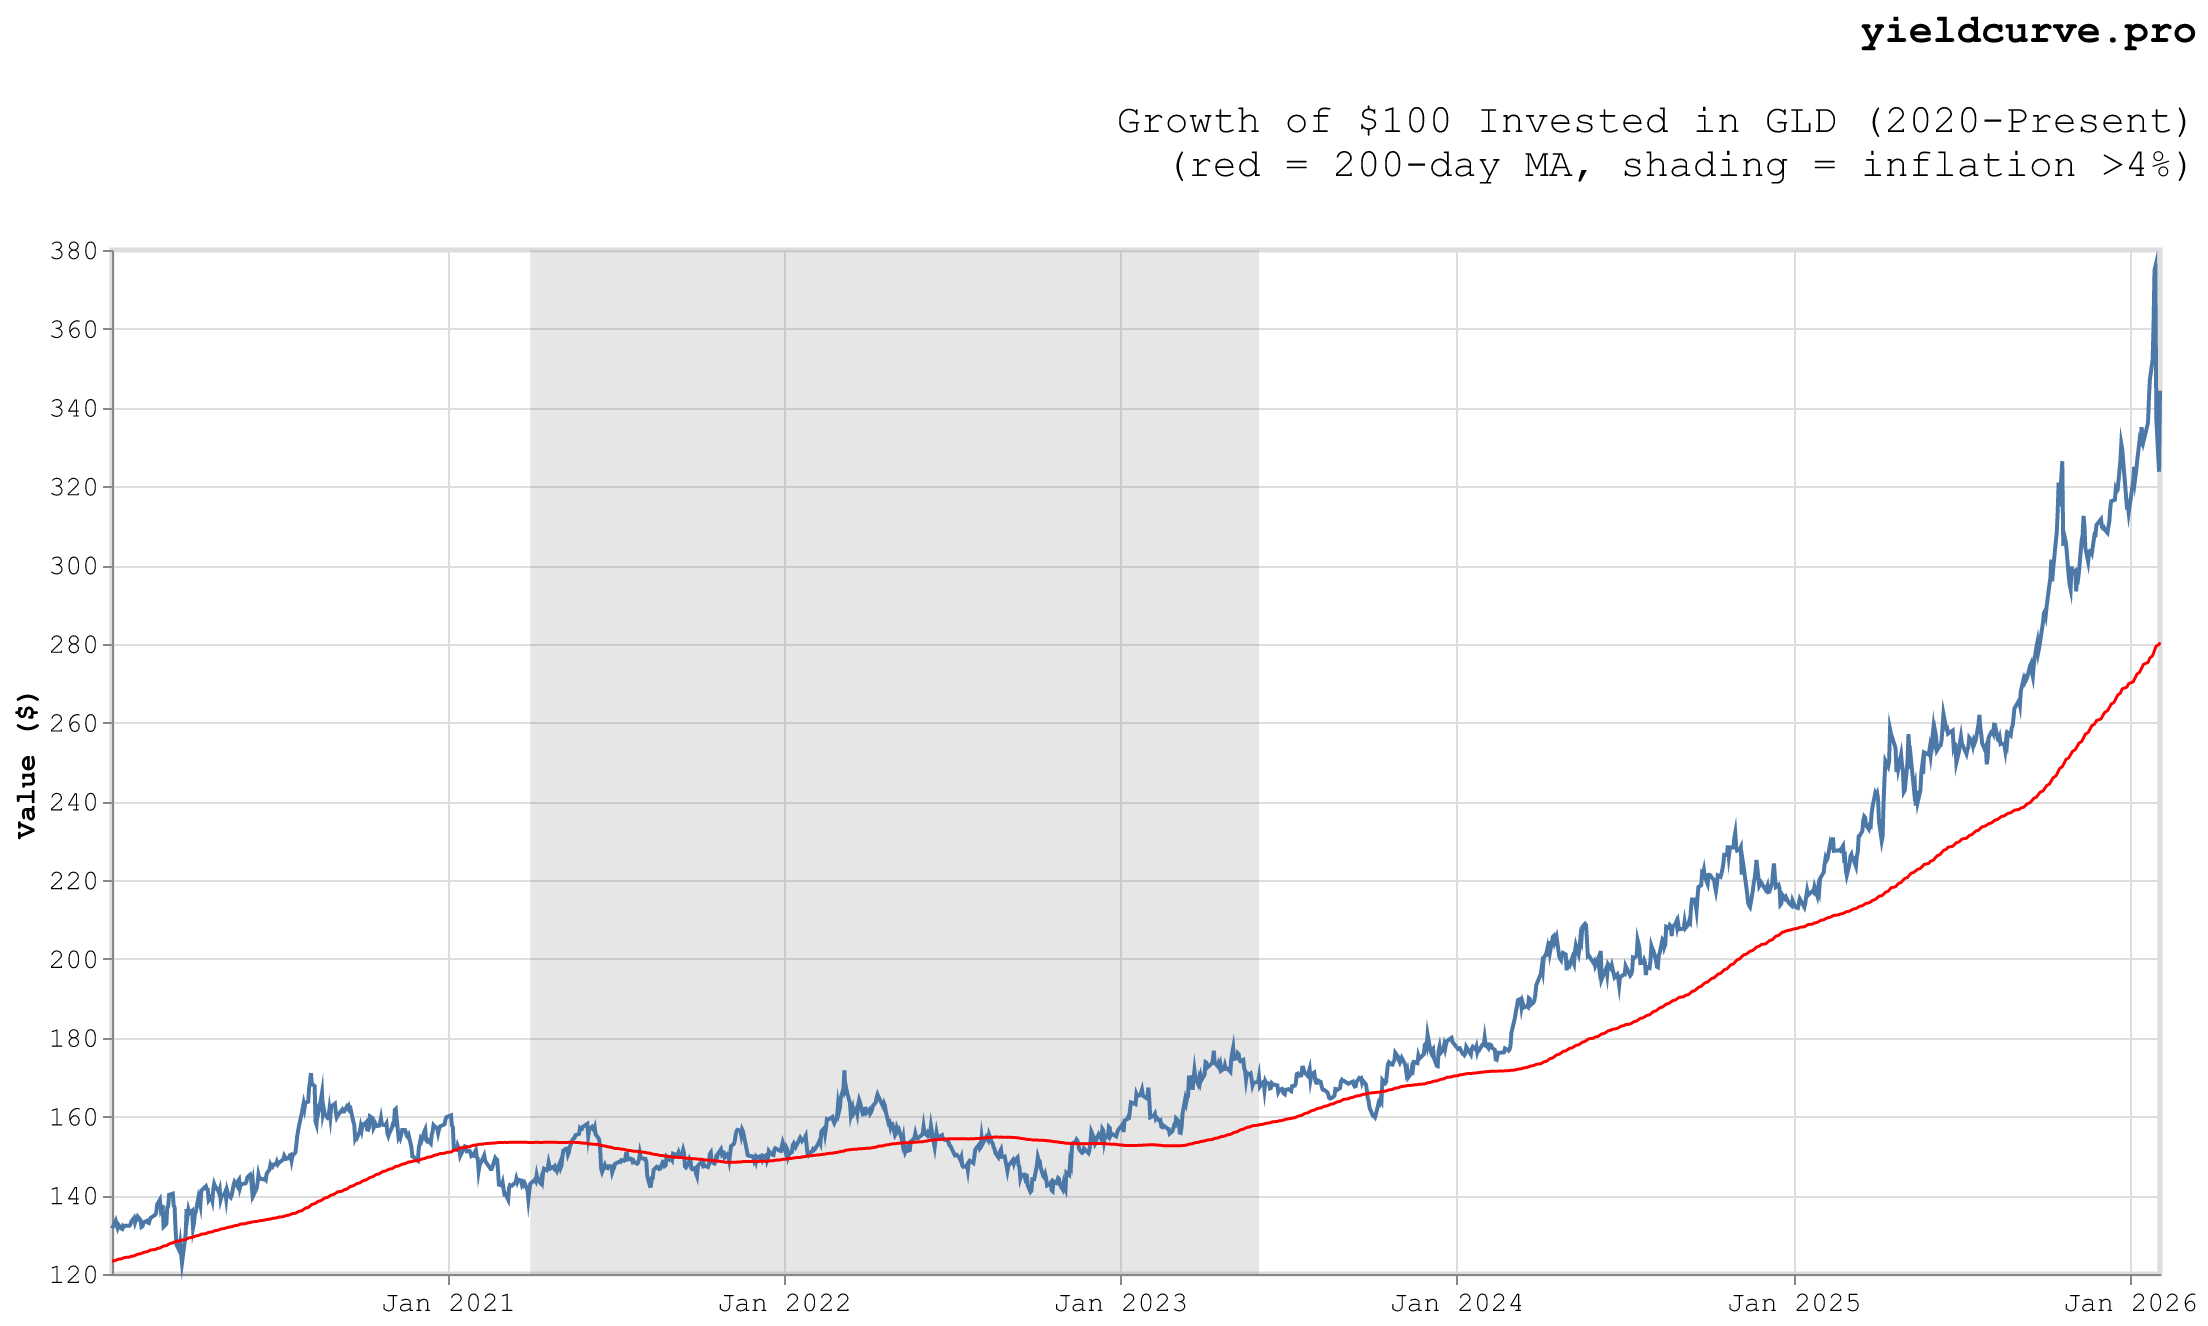
#### **Figure 7**: 200 Day Moving Average, Cumulative Value of \$100 Invested in Gold (GLD)
So, from both a diversification and price perspective, GLD seems worth adding to
a basic stock-bond portfolio.
#### FAQ
##### Does adding gold to a stock-bond portfolio provide diversification?
Yes, based on the data analyzed in Part 4 of the series. Gold's correlation with both equities and Treasuries has historically been low and was, as of the post, as close to zero as in the full dataset starting 2008. The diversification benefit is strongest when stock-bond correlations are positive, which tends to coincide with higher-inflation regimes.
##### How does the stock-bond correlation regime affect gold's role in a portfolio?
When stock-bond correlation is negative, Treasuries already hedge equity drawdowns and gold's diversification value is muted. When correlation flips positive, which the post links empirically to core inflation rates, Treasuries lose hedging power and gold's near-zero correlation with both becomes valuable. The pattern holds across one, two, and three year trailing windows.
##### What returns has GLD delivered since 2008?
The post measures GLD over 2008-01-28 to 2026-02-04: 244.0% total return, 7.4% CAGR, 17.7% annualized volatility, Sharpe ratio of 0.49, and a maximum drawdown of -45.4%. Daily win rate was 52.8%. These statistics reflect a single ETF, not bullion or futures, and inherit GLD's expense ratio.
##### How does Part 4 differ from the earlier posts in this series?
Parts 1 through 3 established the framework on a shorter window of data. Part 4 extends the analysis through early 2026 and adds an explicit link between trailing core inflation and the realized stock-bond correlation regime. The conclusion that gold belongs in a diversified portfolio is reaffirmed under the updated data.