# Does The Yield Curve Follow a Cycle?
Source: https://www.yieldcurve.pro/blog/is-the-yield-curve-cyclical
Published: 2024-01-15
Tags: Bear Steepener, Economic Cycle, Yield Curve
_A simple study to determine if the yield curve actually follows a somewhat predictable cycle._
# Does The Yield Curve Follow a Cycle?
As a quick reminder refer to this
post
for an update on Bear/Bull/Flattener/Steepener(s). In this post we compute the
four different regimes with a 6 month look back window. Level is proxied by
the 10 Yr Note and Slope the 10 Yr less the 3 Mo.
Now, the prevailing view about the different yield curve regimes is that they
exhibit some amount of cyclicality. Generally speaking the following table
shows the progression in the regimes and what each represents with respect
to the economic cycle:
| Current Regime | Subsequent Regime | Interpretation |
|:--------------:|:-----------------:|:--------------:|
| Bear Flattener | Bull Flattener | Expansion |
| Bull Flattener | Bull Steepener | Slowdown |
| Bull Steepener | Bear Steepener | Recession |
| Bear Steepener | Bear Flattener | Recovery |
#### **Table 1**: Typical Yield Curve Regime Transition Order and Interpretation
Is this a reasonable framework and is it one that we should be interpreting
literally? In other words, should we expect one regime to follow the next
one in lock-step? Or should we expect this be a general guideline with
occasional reversals or skips in the order?
Before we think about this too much more let's do the lazy thing and simply
see what the data says. We construct estimates of each regime using yield
curve data beginning in 2001. These are depicted in Figure 1.
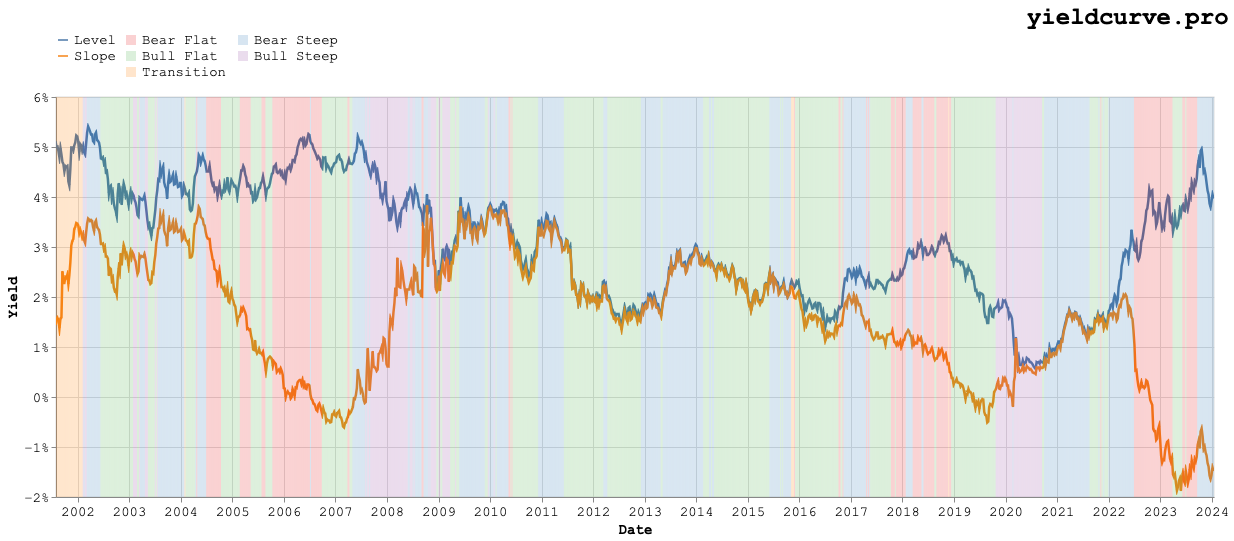 #### **Figure 1**: Yield Curve Regimes: 2001 to the Present
So what does the data say? Table 2 shows the frequencies in percent.
| | Bear Flattener | Bull Flattener | Bull Steepener | Bear Steepener |
|:---------------|---------------:|---------------:|---------------:|---------------:|
| Bear Flattener | 75.86% | 15.52% | 1.72% | 6.90% |
| Bull Flattener | 8.33% | 78.57% | 5.95% | 7.14% |
| Bull Steepener | 2.13% | 6.38% | 76.60% | 14.89% |
| Bear Steepener | 8.11% | 8.11% | 5.41% | 78.38% |
#### **Table 2**: Yield Curve Regime Transition Frequencies
Current regimes are shown in each row. The columns show the percent of time
each subsequent regime follows the previous one. Not too surprisingly each
yield curve regime exhibits a high degree of serial correlation.
Current regimes have a certain amount of inertia and tend to follow themselves
month over month. The probability of one regime being followed by itself
ranges from 75.86% to 78.57%.
Excluding the instances where a regime is followed by itself, the most likely
regime to follow another is shown in Table 3.
| Current Regime | Subsequent Regime | Frequency |
|:--------------:|:-----------------:|:---------:|
| Bear Flattener | Bull Flattener | 15.52% |
| Bull Flattener | Bear Flattener | 8.33% |
| Bull Steepener | Bear Steepener | 14.89% |
| Bear Steepener | Bear Flattener | 8.11% |
#### **Table 3**: Largest Non-same Frequencies
These numbers do not support a strictly cyclical view of transitions between
yield curve regimes as they do not amount to a closed loop circuit.
Table 4 shows the corresponding frequencies for the economic cycle implied
order which does comprise a closed loop:
| Current Regime | Subsequent Regime | Frequency |
|:--------------:|:-----------------:|:---------:|
| Bear Flattener | Bull Flattener | 15.52% |
| Bull Flattener | Bull Steepener | 5.95% |
| Bull Steepener | Bear Steepener | 14.89% |
| Bear Steepener | Bear Flattener | 8.11% |
#### **Table 4**: Economic Cycle Implied Order Frequencies
Based on the limited set of data we consider the magnitude of these frequencies
look more or less the same as the ones shown in Table 3 with the exception of
the Bull Flattener to Bull Steepener frequency. This suggests that it is
possible the yield curve loosely follows a cycle.