# The Bulk of Treasury ETF Losses Occurred by October 2023
Source: https://www.yieldcurve.pro/blog/the-bulk-of-treasury-etf-losses-occurred-by-october-2023
Published: 2026-09-30
Tags: AGG, Bonds, Bond Sell-off, Drawdown, Duration, ETFs, Fixed Income, IEF, IEI, SHV, SHY, TLH, TLT, US Treasury, iShares
_Treasury yields rose again in 2026, and commentary describes a continued bond sell-off. Six iShares Treasury ETFs show that most of the losses occurred between August 2020 and October 2023. Since the October 2023 low, five of the six funds have trended upward. The 2026 decline is small next to the earlier losses._
---
title: The Bulk of Treasury ETF Losses Occurred by October 2023
synopsis: Treasury yields rose again in 2026, and commentary describes a continued bond sell-off. Six iShares Treasury ETFs show that most of the losses occurred between August 2020 and October 2023. Since the October 2023 low, five of the six funds have trended upward. The 2026 decline is small next to the earlier losses.
tags: AGG, Bonds, Drawdown, Duration, ETFs, Fixed Income, IEF, IEI, SHV, SHY, TLH, TLT, US Treasury, iShares
slug: treasury-etf-drawdowns
date: 2026-09-30
---
# Most Treasury ETF Losses Occurred by October 2023
Treasury yields have risen again in 2026. On September 28, the [10 Yr yield](https://www.yieldcurve.pro/yields/10-year) closed at 5.24%, its highest close since June 2007. Long-term Treasury funds have fallen since June, and commentary describes a continued bond sell-off.
The losses are real, but most of them are not recent. Treasury funds lost heavily from 2020 to 2023. Their worst losses ended almost three years ago, and every fund has gained since. Figure 1 shows six iShares Treasury ETFs from January 2007 to September 2026.
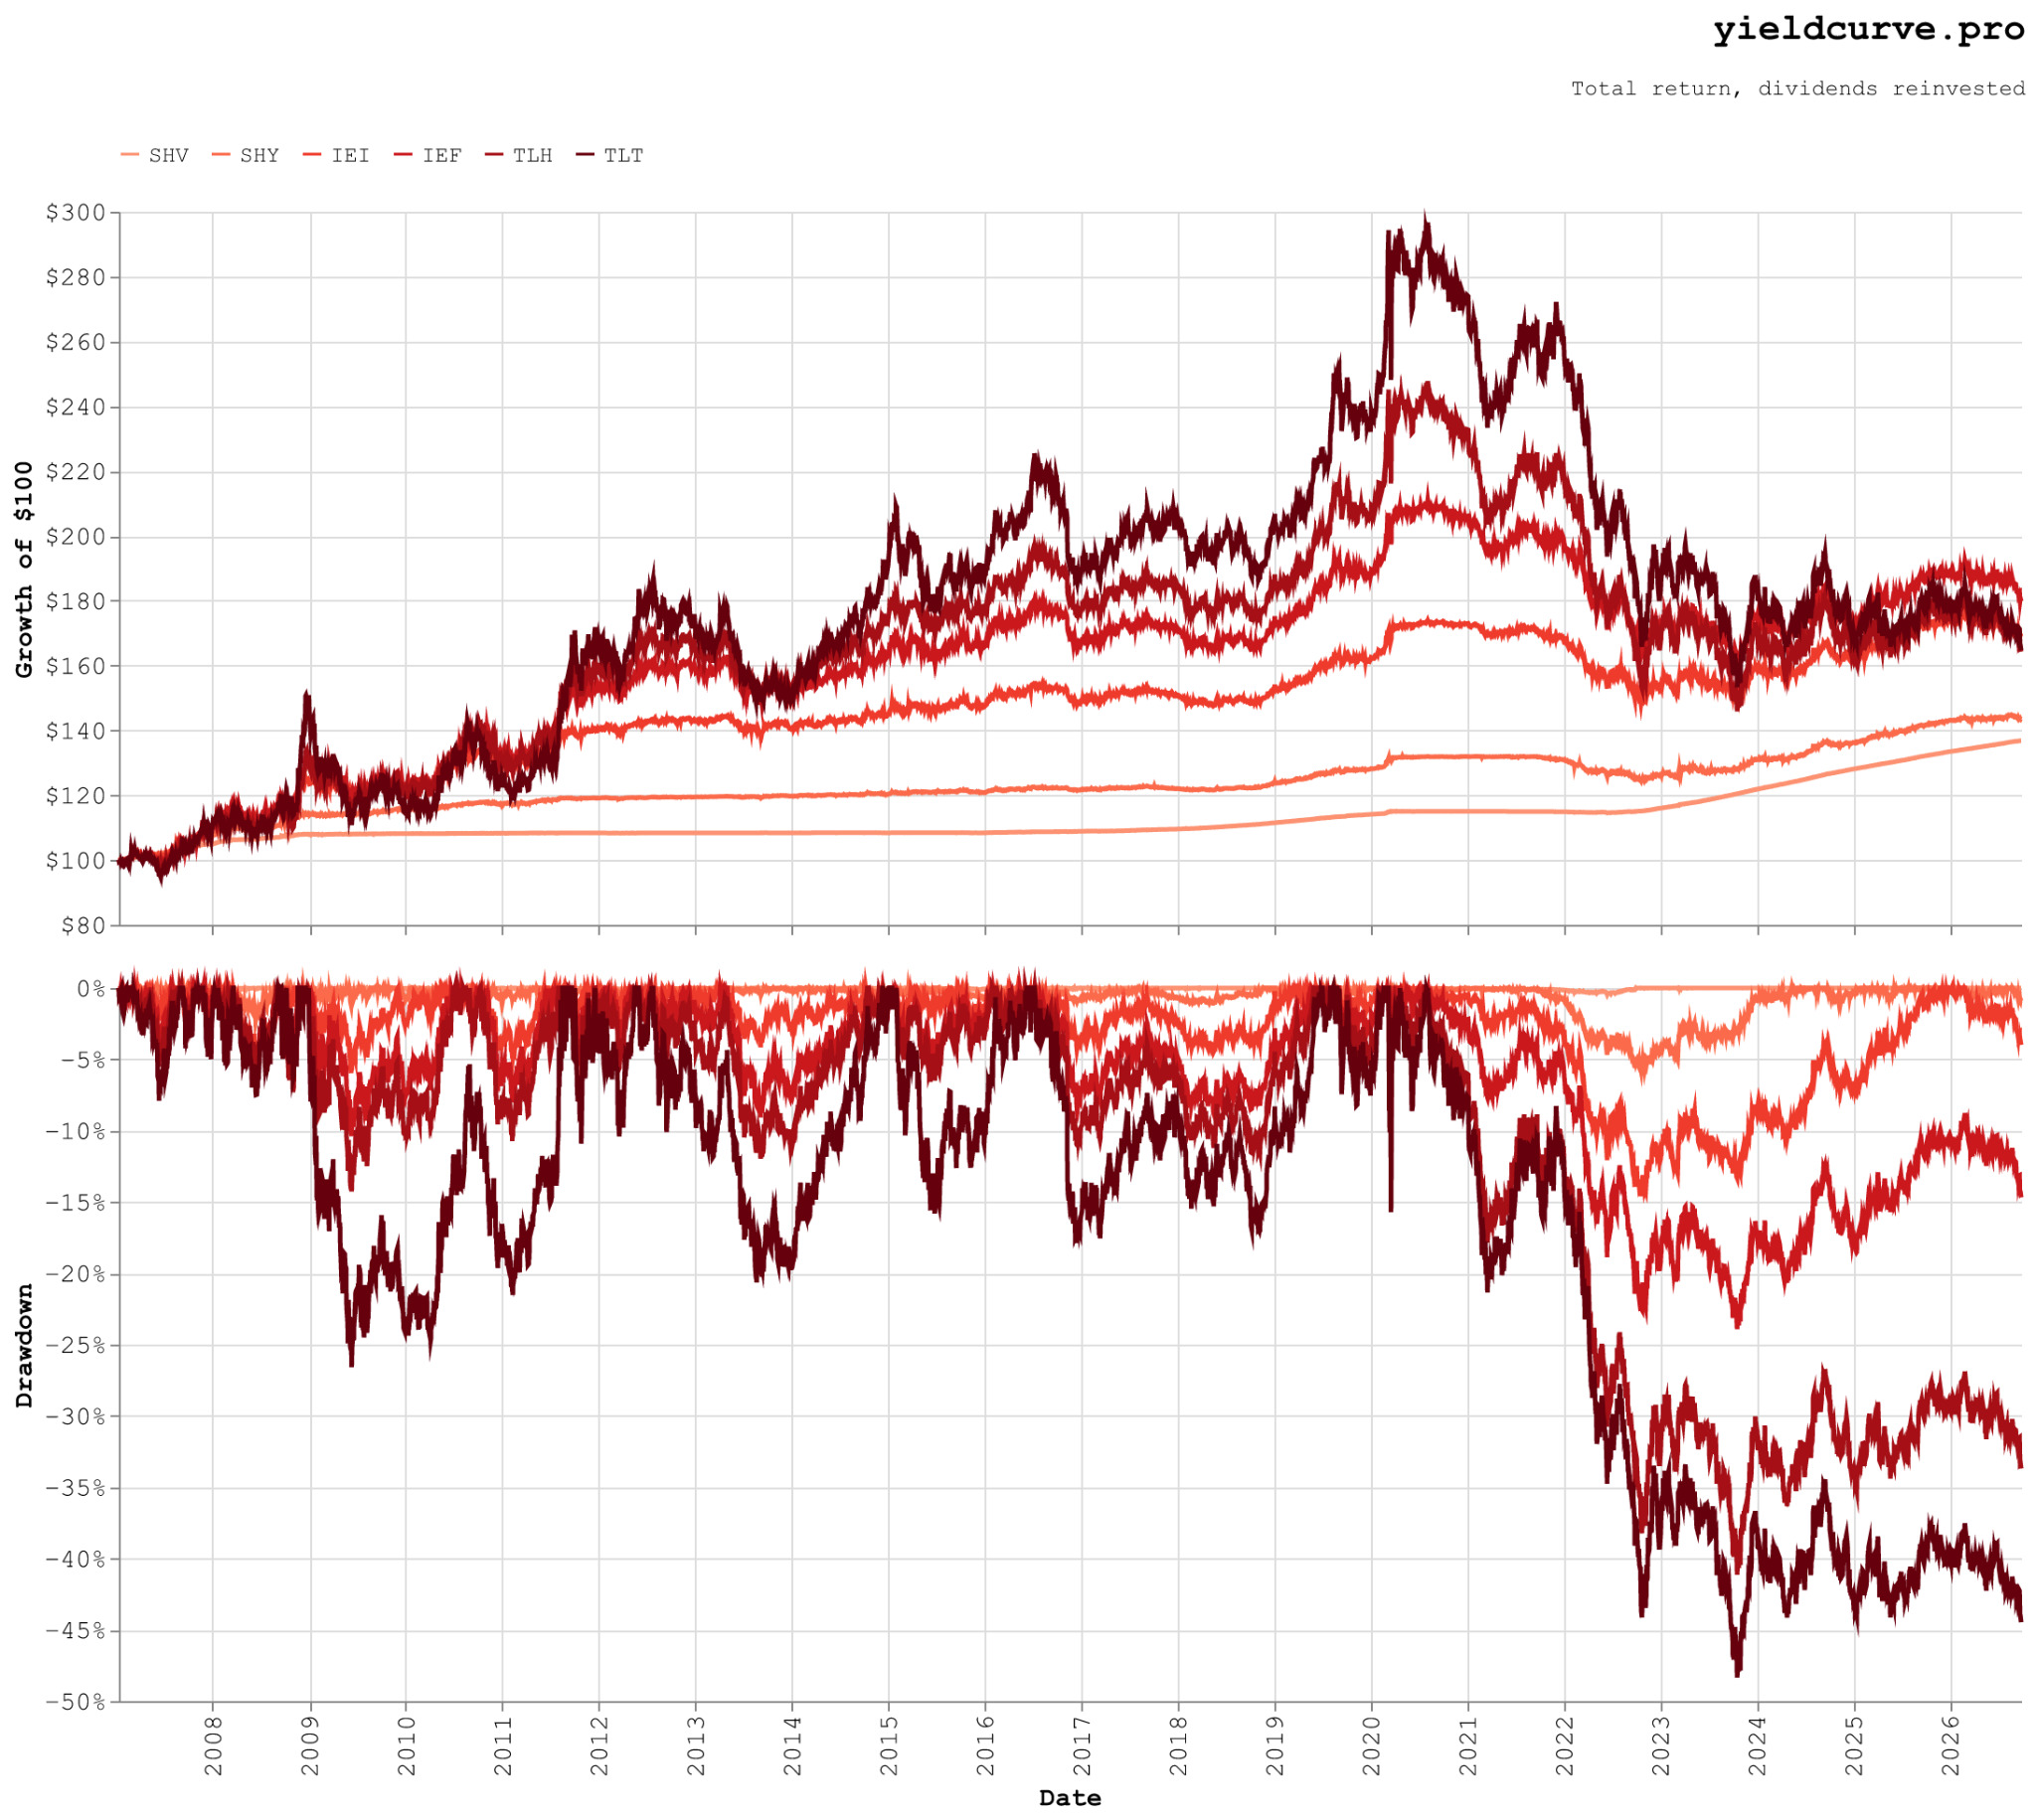
*Figure 1: Growth of \$100 (top) and drawdown (bottom) for six iShares Treasury ETFs, daily total return from 2007-01-11 to 2026-09-28. Source: Yahoo Finance adjusted closes.*
| ETF | Maturity | \$100 became | Annualized return | Volatility | Worst drawdown | Below peak now |
|---|---|---:|---:|---:|---:|---:|
| SHV | 0-1 Yr | \$136.83 | 1.60% | 0.35% | -0.45% | 0.00% |
| SHY | 1-3 Yr | \$143.42 | 1.85% | 1.52% | -5.71% | -0.89% |
| IEI | 3-7 Yr | \$169.01 | 2.70% | 4.10% | -14.60% | -3.98% |
| IEF | 7-10 Yr | \$179.83 | 3.02% | 6.92% | -23.92% | -14.69% |
| TLH | 10-20 Yr | \$164.28 | 2.55% | 10.49% | -41.14% | -33.69% |
| TLT | 20+ Yr | \$164.76 | 2.57% | 15.03% | -48.35% | -44.47% |
*Table 1: Results from 2007-01-11 to 2026-09-28. Volatility is annualized from daily returns.*
## The losses from 2020 to 2023
On August 4, 2020, the 10 Yr yield closed at 0.52%. That was its lowest close since the [Federal Reserve's daily series](https://fred.stlouisfed.org/series/DGS10) began in 1962. IEI, IEF, TLH and TLT peaked that day. By October 19, 2023, the 3 Mo yield had risen 5.51 percentage points, the 10 Yr 4.46 and the 30 Yr 3.92. Over the same period, [consumer price inflation](https://fred.stlouisfed.org/series/CPIAUCNS) peaked at 9.1% in June 2022, the highest rate since November 1981.
Losses grew with maturity, from 0.45% for SHV to 48.35% for TLT (Table 1). AGG, which tracks the Bloomberg US Aggregate Bond Index, fell 18.43%. That was its largest decline since it began trading in 2003.
## The recovery since October 2023
IEF, TLH and TLT hit their lows on October 19, 2023. IEI and SHY hit theirs a year earlier, and SHV in June 2022. No fund has fallen back to its low since.
Every fund has gained since October 19, 2023. SHY, IEI, IEF and TLH each returned between 12.03% and 12.65%. SHV returned 13.60% and TLT 7.51%. A trend line fitted to each fund since then rises about 4% a year for SHV, SHY, IEI and IEF, and 2.55% a year for TLH. TLT is the exception, with a flat trend of 0.31% a year.
Yields are higher than they were at the low. The 10 Yr yield is up 0.26 percentage points from 4.98% on October 19, 2023. IEF's share price is still 0.65% higher. Nearly all of its 12.14% return came from interest.
## The 2026 decline
Since June 30, TLT has fallen 7.97%, TLH 6.51% and IEF 4.35%. TLT's drawdown reached 44.47% on September 28, its largest since November 2023. It is still 3.88 percentage points above its 2023 low. IEF and TLH are further above their lows. IEF is 14.69% below its peak, against 23.92% at its low. TLH is 33.69% below, against 41.14%.
The decline has given back part of the recovery. It has not taken any fund below its 2022 or 2023 low.
## Yields and expected returns
On September 28, every Treasury maturity from 5 Yr to 30 Yr yielded more than 5%. Our recent post [What a Treasury Fund's Yield Tells You About Its Return](https://www.yieldcurve.pro/blog/treasury-fund-yield-as-forecast) found that a fund's yield predicts its return best over about twice its duration, minus one year. For IEF, with an [effective duration](https://www.ishares.com/us/products/239456/ishares-710-year-treasury-bond-etf) of 6.84 years, that is about thirteen years.