# US Treasury Auction (Ex Ante)
Source: https://www.yieldcurve.pro/blog/treasury-auction-btc-001
Published: 2024-01-11
Tags: Auction, Bid to Coverage Ratio, Bills, Bonds, Notes, US Treasury
_Evaluating the Health of Today's US Treasury Auction_
# Evaluating the Health of Today's US Treasury Auction
In a previous
post
we provided a brief primer on some of the mechanics of US Treasury (UST)
auctions. We begain with a quick refresher on the basic types of securities
(show in Table 1) auctioned and issued by UST.
| Security | Tenors | Description |
| :------ | :----------------------------- | :--------------------------------------------- |
| Bills | 4 to 52 weeks | sold at a discount and redeemed at par |
| Notes | 2, 3, 5, 7, 10 years | pay a fixed rate of interest 2X per year |
| Bonds | 20, 30 years | pay a fixed rate of interest 2X per year |
| CMB | less than 1 year | cash management bills for short-term financing |
| TIPS | 5, 10, 30 years | pay a fixed rate on a principal indexed to CPI |
| FRN | 2 years | pay a variable rate of interest 4X per year |
#### **Table 1**: Securities Auctioned and Issued by the US Treasury
In this post we will only be considering Bills since today's auction (for a
schedule refer to this
link)
only offers 4- and 8-Week Bills.
In the last post we touched on the Bid-to-Cover (BTC) ratio which is a
statistic that compares the total dollar amount of bids over the dollar amount
of bonds sold. A BTC of 1 implies that supply (in the form of the dollar
amount UST hopes to raise) was exactly matched by demand (the bids sought by
auction participants). Healthier auctions should have BTC a far above 1 as
possible.
Figure 1 shows the time-series of BTC for Bills, Notes, and Bonds from 2001 to
the present.
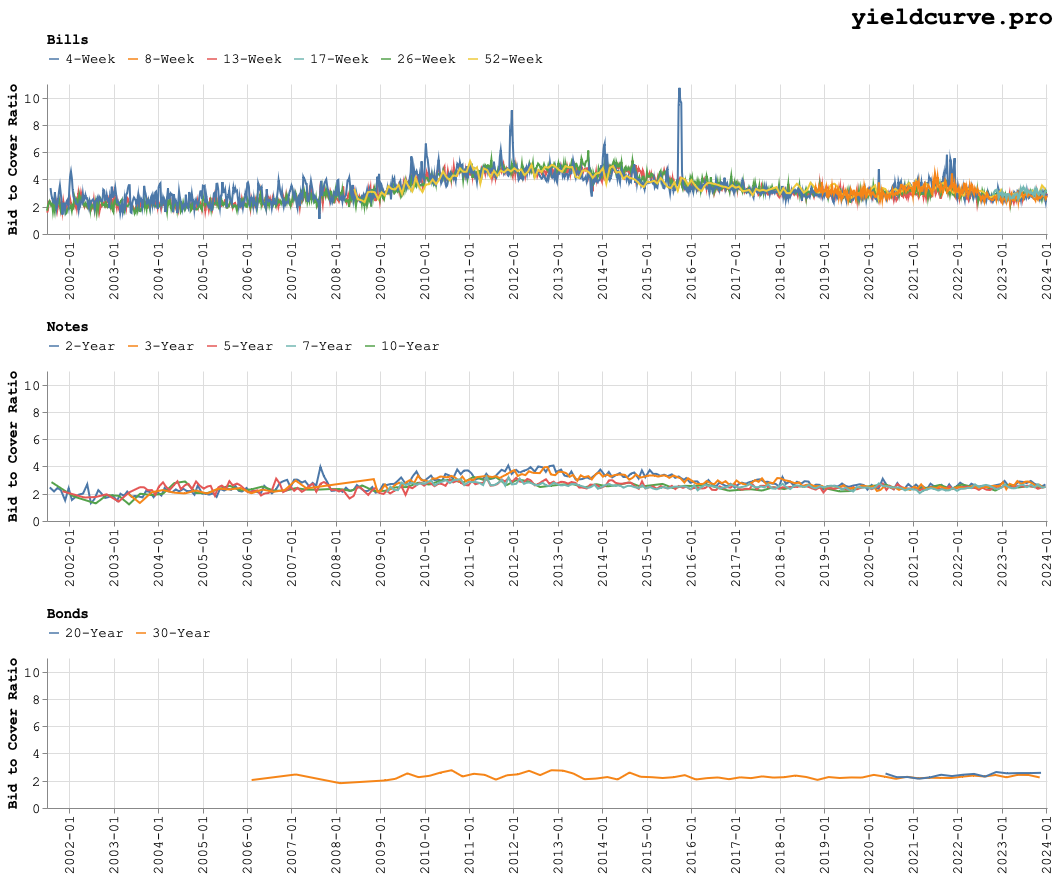 #### **Figure 1**: BTC for Bills, Notes, and Bonds: 2001 to the present
Let's examine the distribution density diagram (DDD) for the 2 tenors up for
auction today. For the 4- and 8-Week Bills these are shown by Figures 2 and 3.
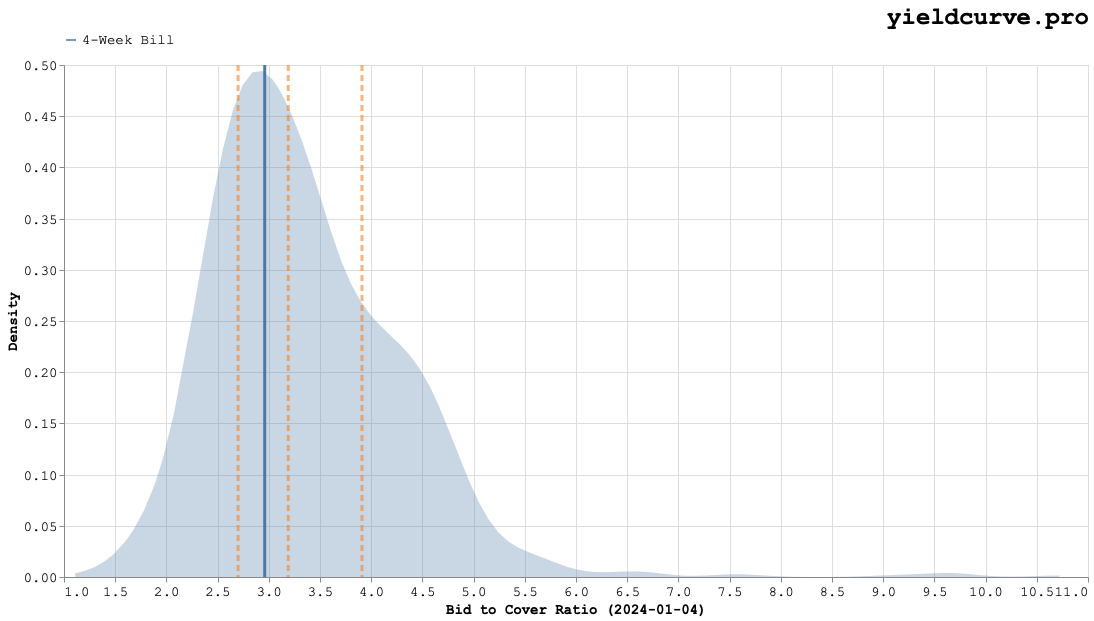 #### **Figure 2**: 4-Week Bill BTC Distribution Density Diagram
The mean and interquartile ranges on the DDD are indicated with the vertical
orange dashed lines. The left- and right-most lines indicate the 25-th and
75-th percentiles, respectively. The middle line corresponds to the median.
For the the 4-Week Bill, BTC seems to fall close to the mode of the
distribution and comfortably between the median and 25-th percentile and
median.
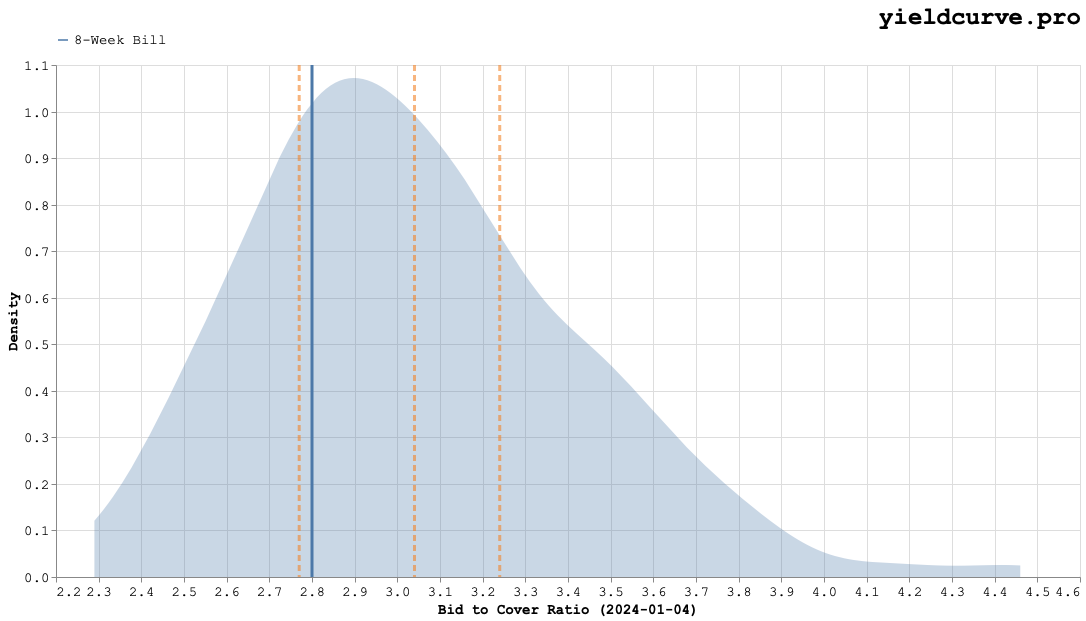 #### **Figure 3**: 8-Week Bill BTC Distribution Density Diagram
The the 8-Week Bill BTC is well below both the mode and median yet greater than
the 25-th percentile. For both tenors it appears that the most recent auctions
were below historical expectations. This suggest auction health has
deteriorated recently. We will be keeping a close eye on today's auctions and
assessing where they fall in either tenors' DDD.