# Prediction Markets Meet the Yield Curve
Source: https://www.yieldcurve.pro/blog/prediction-markets-meet-the-yield-curve
Published: 2026-03-10
Tags: Feature, Federal Funds Rate, Federal Reserve, FOMC, Forecasting, Kalshi, Prediction Markets, US Treasury, Yield Curve
_YCP's new Odds page brings Kalshi and Polymarket implied probabilities for Treasury yields, spreads, and Fed decisions — bridging prediction markets and fixed-income analytics on a single screen._
# Prediction Markets Meet the Yield Curve
Prediction markets now forecast Treasury yields with a track record that embarrasses the sell side. YCP's new Odds page puts those probabilities next to the yield curve data you already use — no tab-switching required.
## What the Odds Page Shows
The page aggregates live prediction market data from two venues — Kalshi and Polymarket — across three categories:
- **Levels**: Bracket markets on the 10Y daily and weekly yield, quarterly par yields for the 2Y, 5Y, 10Y, and 30Y, and 3-month T-bill yields.
- **Slopes**: Threshold markets on the 10Y−2Y and 10Y−3M spreads — the two curve measures that drive most regime calls.
- **Fed Funds**: FOMC meeting outcome markets pricing cuts, holds, and hikes.
Each market card displays outcome labels, implied probabilities as percentages with visual progress bars, and total contract volume. Click through to a detail page and the market sits alongside an embedded yield or spread chart covering the trailing year — so you can compare what the market expects against what the curve has done.
Data refreshes every five minutes. Markets sort by tenor and volume, putting the most liquid contracts first.
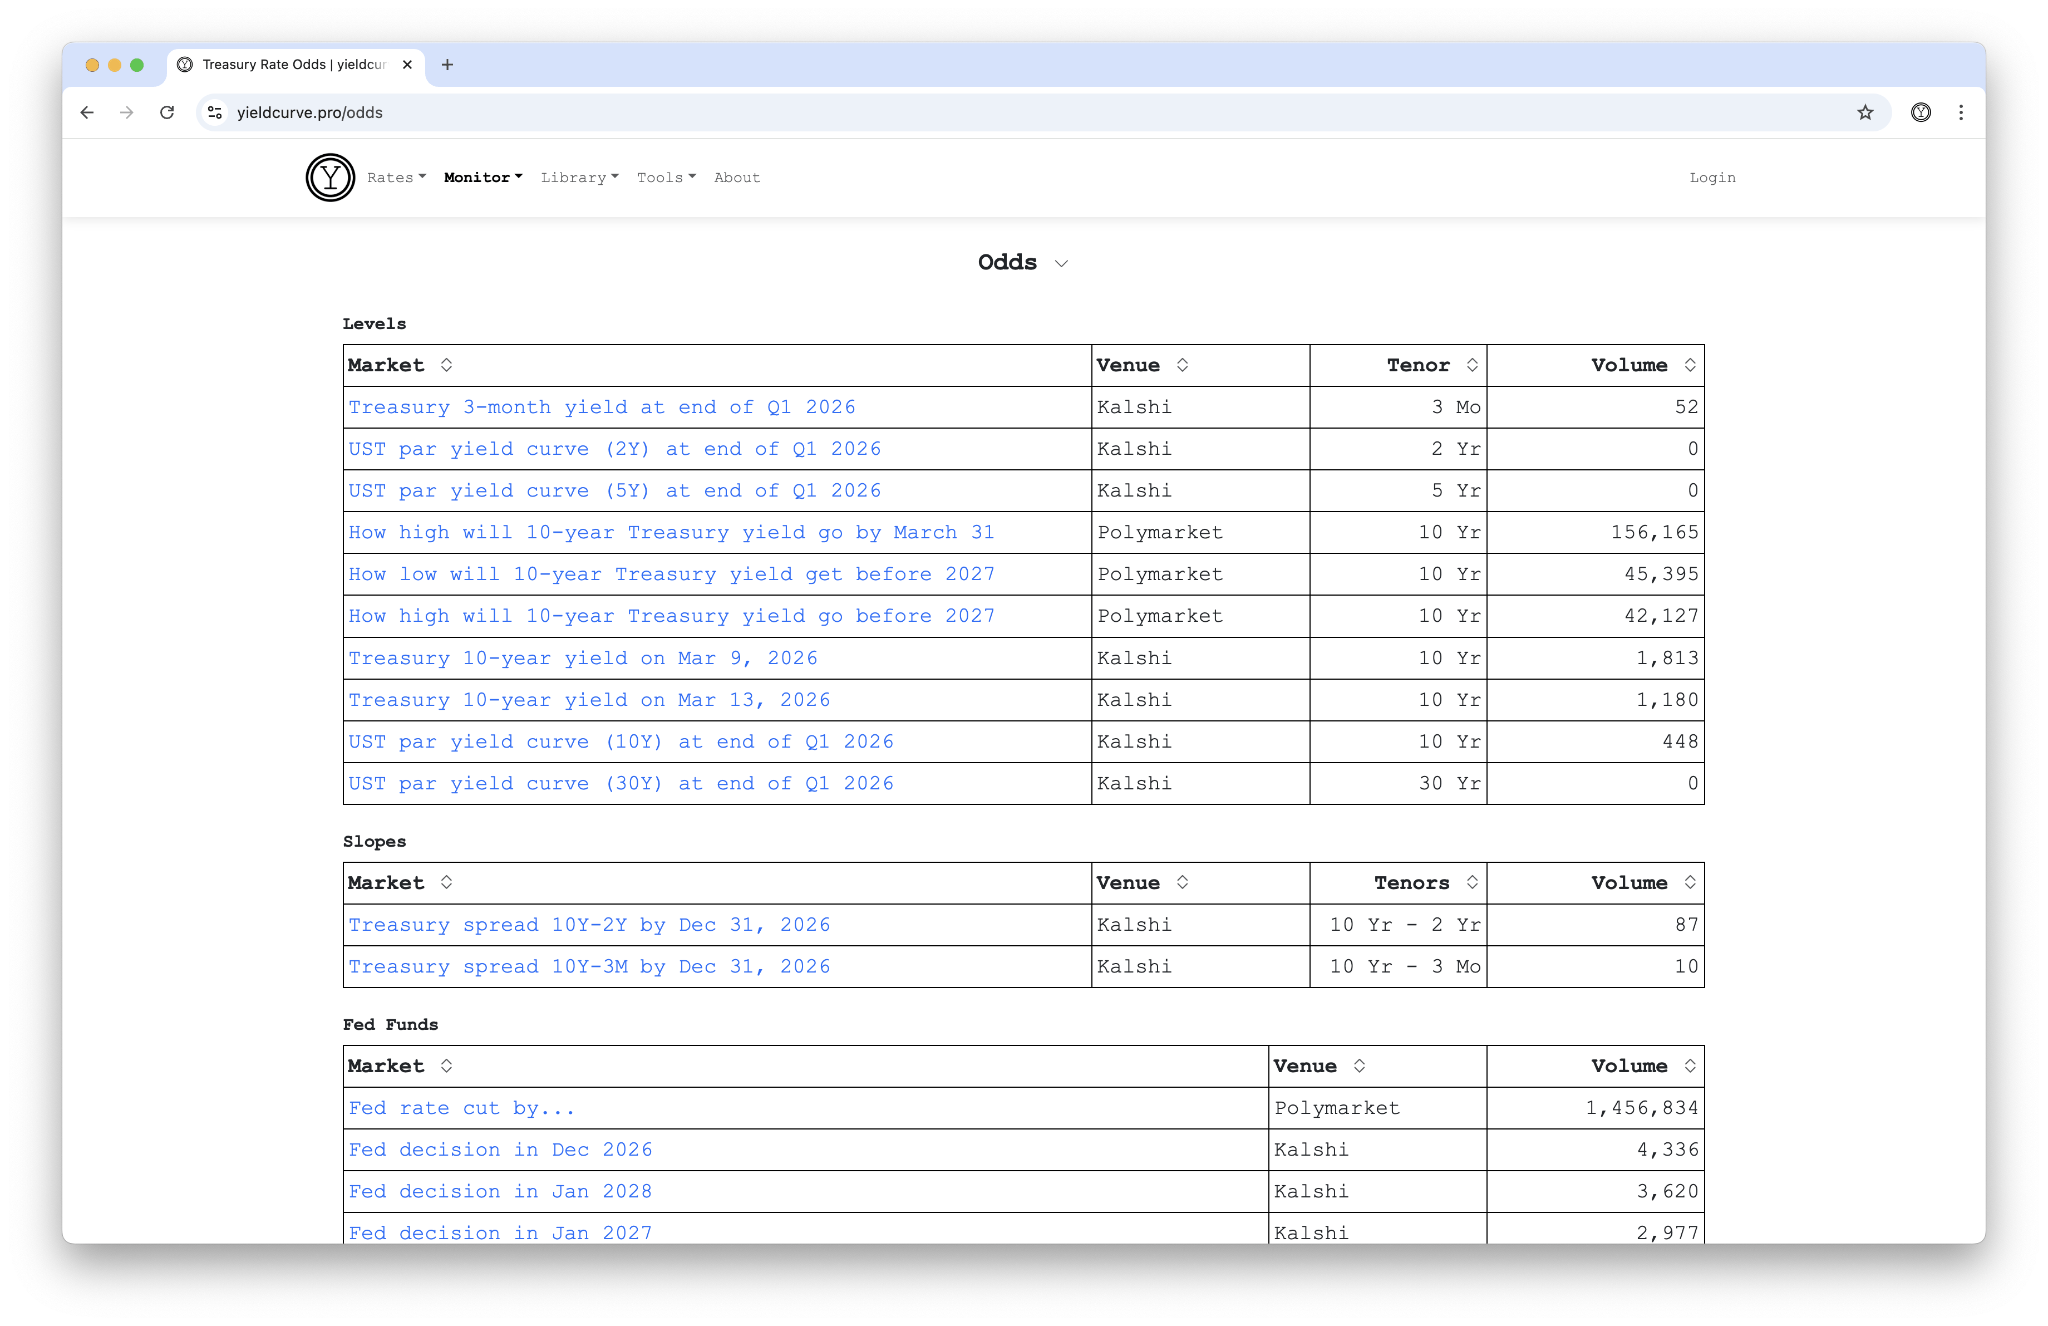
*Figure 1: The Odds landing page — prediction markets grouped by Levels, Slopes, and Fed Funds.*
## Why Prediction Markets Deserve a Seat at the Table
An NBER working paper by Diercks, Katz, and Wright gave prediction markets a rigorous benchmark test — and the results are hard to dismiss. The modal Kalshi forecast for FOMC decisions has maintained a perfect track record from 2022 through mid-2026. In September 2024, when professional forecasters split on the magnitude, Kalshi traders correctly priced a 50 bp cut.
The advantage is structural. The New York Fed's Survey of Primary Dealers runs every six weeks. Bloomberg consensus updates on a similar cadence. Kalshi prices move in seconds. As Katz put it: predictions "react instantly to news, or at a much higher click to news, than waiting six weeks for the next survey." The prediction market industry has grown from \$300 million to \$40–\$50 billion since August 2025 — that volume carries information.
Beyond the Fed, the paper finds Kalshi's headline CPI forecasts run a mean absolute error of 6.3 bps versus 8.1 bps for Bloomberg consensus. Inflation and unemployment forecasts match or beat institutional surveys. A separate Kalshi-authored study reported 40.1% lower MAE on inflation shock forecasts relative to consensus.
## Connecting the Data
We reviewed the underlying research in detail on our paper review of Diercks, Katz & Wright. The paper validates 13 macro contract series on Kalshi — fed funds, CPI, unemployment, GDP, nonfarm payrolls — benchmarked against the FRBNY Survey of Market Expectations, Bloomberg consensus, and fed funds futures. The key finding for rates practitioners: prediction markets deliver distributional information, not just point estimates. You see the full probability surface, not a single median.
The Odds page operationalizes that insight. Instead of toggling between Kalshi's website, Polymarket, and your yield curve charts, the data sits in one place. A 10Y yield bracket market next to the actual 10Y chart. A 10Y−2Y spread market next to the spread history. The juxtaposition makes regime analysis faster — when prediction markets price a steepening and the curve confirms it, the signal compounds.
## What It Means for Duration Positioning
Prediction market probabilities carry a caveat: they reflect consensus, not forecasts. Risk premia and retail participation can skew prices. The NBER paper acknowledges the short sample (2022–2026) and flags that Kalshi's retail-heavy base may behave differently from institutional flow.
Those caveats acknowledged, the tool sharpens one specific workflow: comparing your rate view against the market's. If you hold a duration overweight and Kalshi prices the 10Y above your target with 60% probability, you know where the crowd sits. If the spread markets price an inversion and your regime model calls a steepening — that disagreement is worth investigating.
The Odds page updates regularly alongside the rest of YCP's yield curve data. Use it as a complement, not a substitute, for your own analysis.