# How Good Have Recent US Treasury Auctions Been?
Source: https://www.yieldcurve.pro/blog/treasury-auction-grades-002
Published: 2024-05-14
Tags: Auction, Bid-to-Coverage Ratio, Bills, Bonds, Direct Bids, Indirect Bids, Notes, Price Tail, US Treasury
_Looking At The Most Recent Auction By Tenor_
# Grading The Most Recent Auctions By Tenor
In
this
recent blog post we described a simple, yet systematic, approach to grading US
Treasury auctions. Like before, we examine the following data items:
* **Tail** - This is the difference between the highest and average yield
obtained by auction participants (reported in basis points). It is indicative
of whether or not all buyers paid a similar price or did some get bonds on the
cheap. A small tail relative to history is considered better.
* **Bid-to-Cover (BTC)** - This measures the total amount of bids received for a given
auction divided by the amount actually sold. Higher relative to history is
better.
* **Indirect** - This is the percentage of non-competitive bidders (typically
foreigners) placing bids through a primary dealer. They participate this way
because they are often unable or unwilling to do so directly. Higher relative
to history is better.
* **Direct** - The is the percentage of institutions who are placing bids on the
auction directly with the US Treasury. Higher relative to history is better.
We use them to grade different tenor auctions in a standardized way. This
allows us to compute an overall composite score to judge subsequent auctions
relative to passed ones.
Table 1 shows these data tabulated for the most recent auction held for each tenor.
| Date | Tenor | Total | Avg | Hi | Tail | BTC | Indirect | Direct |
|:-----------|:--------|--------:|------:|-----:|-------:|------:|-----------:|---------:|
| 2024-09-05 | 4-Week | 74 | 5.22 | 5.27 | 5 | 2.93 | 67.1 | 4.9 |
| 2024-09-05 | 8-Week | 78 | 5.26 | 5.28 | 2 | 2.98 | 59.7 | 7.7 |
| 2024-13-05 | 13-Week | 68 | 5.24 | 5.25 | 1 | 2.77 | 58.3 | 6.1 |
| 2024-08-05 | 17-Week | 59 | 5.23 | 5.24 | 1 | 3.04 | 48.7 | 5.4 |
| 2024-13-05 | 26-Week | 68 | 5.15 | 5.17 | 1 | 3.02 | 61.2 | 7.3 |
| 2024-16-04 | 52-Week | 44 | 4.90 | 4.92 | 1 | 2.88 | 65.8 | 2.4 |
| 2024-23-04 | 2-Year | 68 | 4.85 | 4.90 | 5 | 2.66 | 66.2 | 18.7 |
| 2024-07-05 | 3-Year | 58 | 4.55 | 4.61 | 6 | 2.63 | 65.5 | 19.6 |
| 2024-24-04 | 5-Year | 70 | 4.59 | 4.66 | 7 | 2.39 | 65.7 | 19.2 |
| 2024-25-04 | 7-Year | 44 | 4.66 | 4.72 | 6 | 2.48 | 65.1 | 21.0 |
| 2024-08-05 | 10-Year | 42 | 4.42 | 4.48 | 6 | 2.49 | 65.5 | 18.7 |
| 2024-21-02 | 20-Year | 16 | 4.51 | 4.59 | 8 | 2.39 | 59.1 | 19.7 |
| 2024-09-05 | 30-Year | 25 | 4.58 | 4.63 | 5 | 2.41 | 64.9 | 19.8 |
#### **Table 1**: Auction Raw Data by Tenor
In addition to the factors we use for scoring, Table 1 also reports the following
* **Total Accepted (Total)** - The entire dollar amount auctioned for the given
tenor.
* **Average Yield (Avg)** - The average yield obtained (average price paid) by
auction participants.
* **High Yield (High)** - The highest yield obtained (lowest price paid) by
auction participants.
Table 2 shows the raw data in Table standardized and mapped to letters grades.
This includes the composite grade we calculate based on the average of the
individual factors grades.
| Date | Tenor | Total | Avg | Hi | Tail | BTC | Indirect | Direct | Composite |
|:-----------|:--------|--------:|------:|-----:|:-------|:------|:-----------|:---------|:------------|
| 2024-09-05 | 4-Week | 74 | 5.22 | 5.27 | D+ | D+ | A | C- | C |
| 2024-09-05 | 8-Week | 78 | 5.26 | 5.28 | B- | C | B+ | B | B- |
| 2024-13-05 | 13-Week | 68 | 5.24 | 5.25 | B- | D | A | C | C+ |
| 2024-08-05 | 17-Week | 59 | 5.23 | 5.24 | B+ | B- | D | B- | C+ |
| 2024-13-05 | 26-Week | 68 | 5.15 | 5.17 | B- | D+ | A | B- | B- |
| 2024-16-04 | 52-Week | 44 | 4.90 | 4.92 | B- | D | A | D+ | C |
| 2024-23-04 | 2-Year | 68 | 4.85 | 4.90 | D+ | D+ | A | B- | C+ |
| 2024-07-05 | 3-Year | 58 | 4.55 | 4.61 | D | D+ | A | B+ | C+ |
| 2024-24-04 | 5-Year | 70 | 4.59 | 4.66 | D | D+ | B+ | A | C+ |
| 2024-25-04 | 7-Year | 44 | 4.66 | 4.72 | C | C- | B | B+ | B- |
| 2024-08-05 | 10-Year | 42 | 4.42 | 4.48 | C- | C- | B | B+ | C+ |
| 2024-21-02 | 20-Year | 16 | 4.51 | 4.59 | D | C | D | B+ | C- |
| 2024-09-05 | 30-Year | 25 | 4.58 | 4.63 | B | B- | B+ | B+ | B |
#### **Table 2**: Auction Grades by Tenor
Recent composite grades have been largely average with values ranging from
**C-** to **B**. It is informative to view these results graphically.
Figure 1 shows bar charts for each individual raw factor as a function of
tenor.
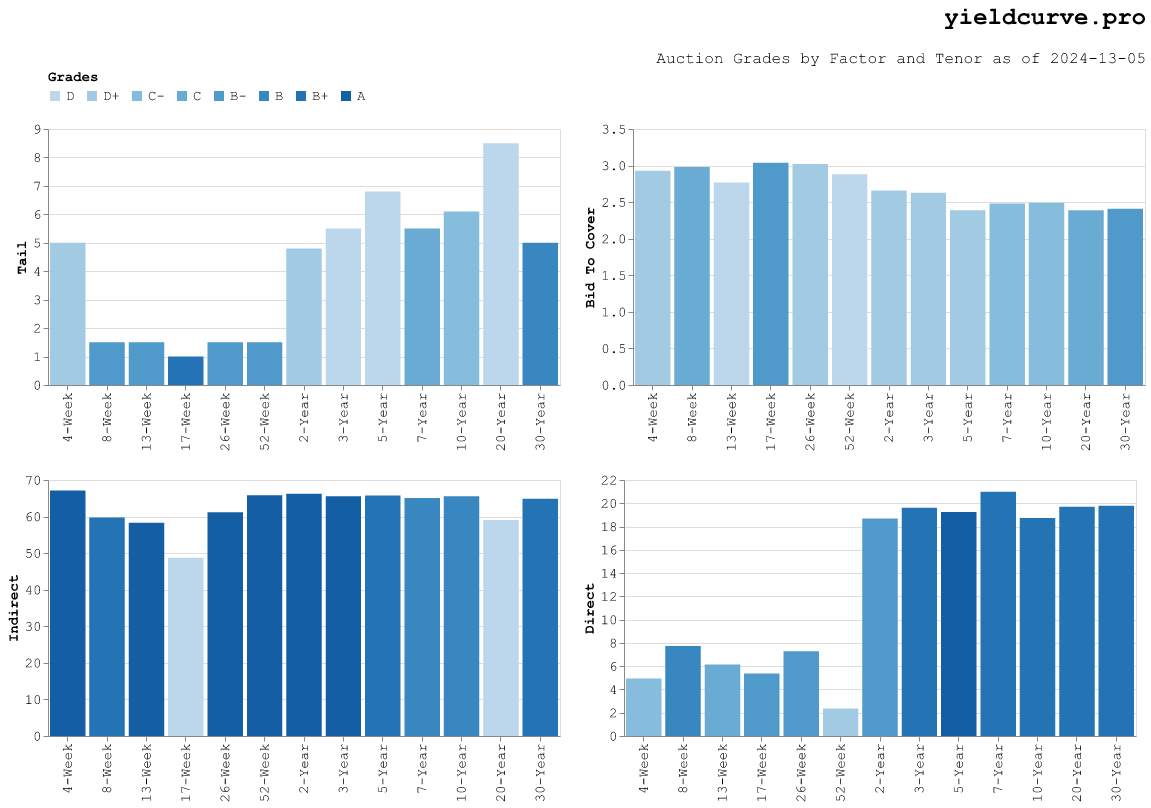
#### **Figure 1**: Auction Grades by Factor and Tenor as of May 13, 2024
Grades have been superimposed on the chart using the color scale shown in the
legend.
Quick visual inspection shows that the higher (and above average) grades have
been earned by the **Indirect** factor. The same is largely true for
**Direct** however there is an interesting stair step in the data between the
52-Week and 2-Year tenors. **Tail** and **Bid-to-Cover** have produced below
average grades.
The raw data and charts for the individual tenors and factors can be
experimented with using the following
app.
If you have any feedback please send it to us
here.
Related reading: Bid-to-Cover Explained: What Treasury Auction Demand Looks Like Across the Curve.