Bid-to-Cover Explained: What Treasury Auction Demand Looks Like Across the Curve
Per the latest Treasury auction history, Tuesday's 10-year reopening cleared at 4.468% with a bid-to-cover of 2.40. Wednesday's 30-year cleared at 5.046% with a bid-to-cover of 2.30, the third-lowest 30-year print of the last twelve months. Both fell below their five-year averages. The latest 2-year print was 2.65, modestly above its five-year mean of 2.63. Demand across the curve is bifurcated, and bid-to-cover is the first number traders check.
Where each tenor stands
The table below uses Treasury auction history to compare the latest print in each coupon tenor with its trailing 12-month average and its five-year mean.
| Tenor | Latest auction | Latest BTC | 12-mo avg | 5-yr avg | 5-yr σ |
|---|---|---|---|---|---|
| 2-Year | 2026-04-27 | 2.65 | 2.60 | 2.63 | 0.13 |
| 5-Year | 2026-04-27 | 2.33 | 2.38 | 2.42 | 0.09 |
| 7-Year | 2026-04-28 | 2.51 | 2.52 | 2.51 | 0.13 |
| 10-Year | 2026-05-12 | 2.40 | 2.39 | 2.47 | 0.11 |
| 20-Year | 2026-02-18 | 2.36 | 2.44 | 2.46 | 0.10 |
| 30-Year | 2026-05-13 | 2.30 | 2.45 | 2.37 | 0.14 |
Table 1: BTC Statistics by Tenor.
The 2-year is hot. At 2.65, it sits 0.2σ above its five-year mean. The belly is softer: the 5-year and 10-year both print below their five-year averages, with the 5-year roughly one standard deviation soft. The long end is mixed. The 20-year stays firm, but this week's 30-year was the third-lowest reading of the last twelve months.
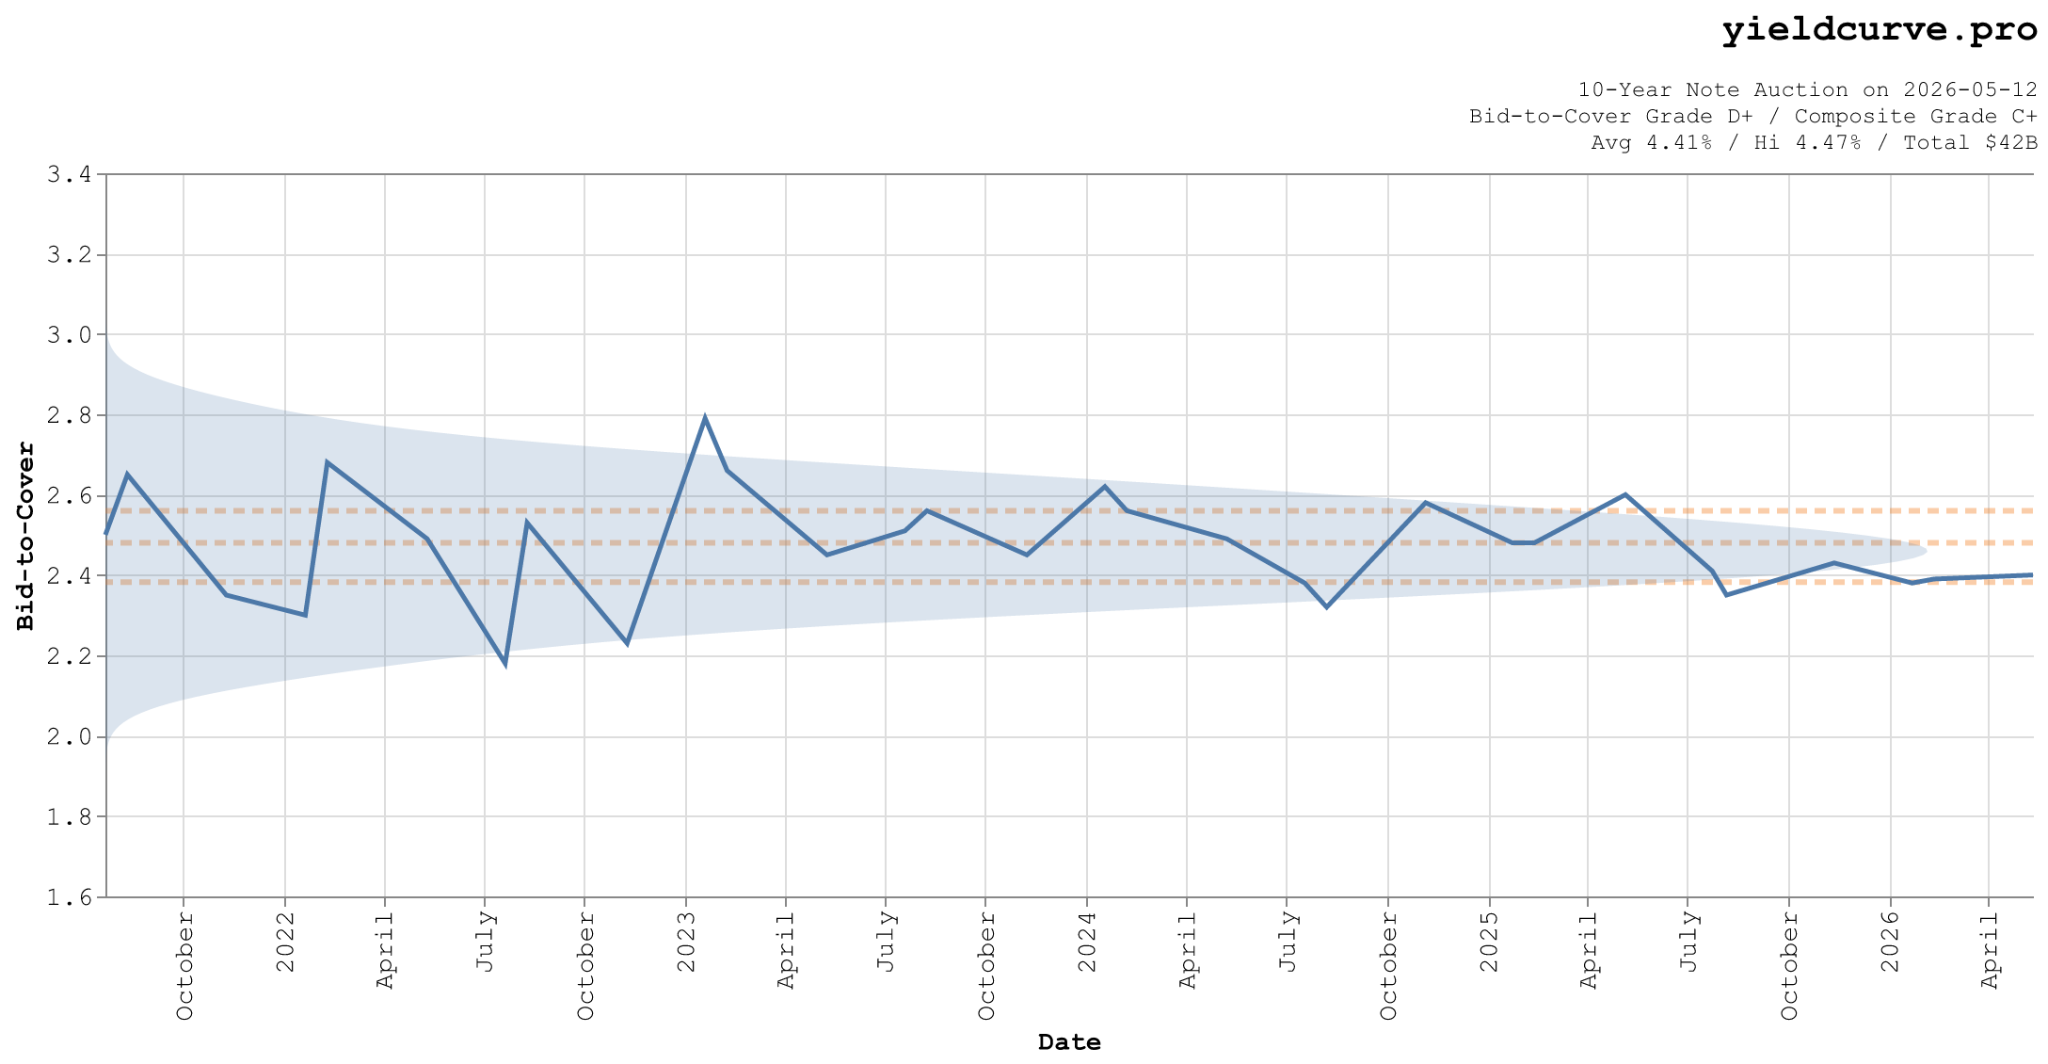
Figure 1: 10-year note bid-to-cover, last 5 years. Orange dashed lines are the Q1, median, and Q3 of the distribution; shaded band is the kernel density. The May 12 print of 2.40 sits below both the series median and its five-year mean.
What bid-to-cover measures
Brookings defines bid-to-cover as total bids divided by debt offered. A 2.40 ratio means \$2.40 was bid for every \$1 sold. Compare each print against the tenor's own history, not a universal cutoff.
Bid-to-cover measures bid volume. The auction "tail" measures pricing: the gap between the auction yield and the when-issued yield just before the bidding deadline. Brookings treats the two as distinct signals, and traders do too. For the full mechanics of how primary dealers, indirect bidders, and direct bidders interact, see the bid-to-cover entry in the glossary.
When a soft auction is noise
The 10-year reopening on September 18, 2025 printed a bid-to-cover of 2.20, the lowest of the last twelve months, with an 8.6 basis point tail. Headlines were grim. Three weeks later, the October 8 reopening cleared at 2.48 with a 5.7 basis point tail. November 12 and November 20 printed 2.43 and 2.41. The September miss sat inside a stable demand regime; it did not start a new one. A weak print that reverses at the next reopening matters less than a sequence of weak prints in the same tenor.
When a soft auction is signal
The 30-year auction on August 10, 2023 cleared at a bid-to-cover of 2.42 with a 7.4 basis point tail, weak by the standards of the period. The October 12, 2023 reopening was worse: bid-to-cover 2.35, tail 9.7 basis points. That pattern matters. A second weak auction in the same tenor is harder to dismiss as noise than one isolated miss.
The May 13 30-year fits the first pattern only tentatively: one weak print after a run of normal ones. The June reopening is the next data point.
If you want to reproduce the table in this post with your own scripts, start with the YCP API docs and use the public examples repo at yieldcurvepro-api-examples.
FAQ
What is a normal bid-to-cover ratio for Treasury auctions?
It depends on the tenor. In Treasury's five-year auction history, the mean bid-to-cover runs about 2.42 for the 5-year, 2.47 for the 10-year, and 2.37 for the 30-year. The latest 2-year print of 2.65 is slightly above its own five-year mean of 2.63. Compare each print against its own maturity's history, not a single curve-wide threshold.
Does a low bid-to-cover mean the Treasury can't sell its debt?
No. Brookings notes that a true failed auction would require a bid-to-cover below 1, and calls that outcome almost impossible because primary dealers are obligated to bid. Read a low bid-to-cover as evidence Treasury had to clear at a higher yield than the market expected, not as a sign the issue could not be sold.
Why do bid-to-cover ratios differ across tenors?
The buyer mix differs across maturities. Treasury allotment data show the split among indirect bidders, direct bidders, and primary dealers shifts by tenor, and the historical bid-to-cover distributions differ as well. A 2.4 can look ordinary in one maturity and soft in another.
How does bid-to-cover relate to the auction "tail"?
They measure different quantities. Bid-to-cover is bid volume. The tail is the gap between the auction yield and the when-issued yield just before the auction. Brookings treats them as separate signals, and the two can point in different directions. A high bid-to-cover with a wide tail is not an all-clear. A low bid-to-cover with no tail is a mixed read. Read them together.
Has bid-to-cover gotten weaker over time?
Tenor by tenor, no. Treasury's five-year auction history puts the latest 12-month average at 2.38 for the 5-year, 2.39 for the 10-year, and 2.45 for the 30-year, close to their five-year averages of 2.42, 2.47, and 2.37. Brookings reaches the same conclusion for 10-year notes: bid-to-cover has not moved much in recent years. The weaker story today is cross-sectional, not a market-wide collapse in auction demand.
How do I analyze auction data in my own code?
Use the YCP REST API as the primary source, then adapt one of the scripts in the public repo: yieldcurvepro-api-examples. The examples show both a sandbox quickstart and a full bid-to-cover study workflow.
Related Reading
- Treasury Auction Liquidity
- Grading US Treasury Auctions
- How Good Have Recent US Treasury Auctions Been?
Live auction-by-auction grades for every tenor live on the auctions tool, which normalizes each metric against its own historical distribution and assigns letter grades from D- to A.
Back
Sign in to leave a comment.
Comments (0)