About
Yield curve analytics. Free, fast, and always current.
yieldcurve.pro provides tools for analyzing US Treasury markets without the institutional price tag. Whether you're managing a portfolio, researching market dynamics, or tracking monetary policy, our platform delivers the data and visualizations you need—updated daily and completely free.
Why yieldcurve.pro?
Treasury yields drive everything from mortgage rates to corporate borrowing costs. The yield curve's shape signals market expectations about growth, inflation, and Fed policy. Yet accessing clean, historical yield curve data and building custom analytics typically requires expensive terminals or building everything from scratch.
We solve this by providing:
- API for fast programmatic access to yield data, auction results, and FOMC decisions
- AI chart assistant that answers questions about the data on each charting page, with live query access to the underlying dataset
- complete historical data back to 2001, refreshed daily from official sources
- curated research including academic papers, book recommendations, and market commentary
- interactive charting tools for levels, slopes, inversions, and regime analysis
- dedicated pages for every tenor, spread, regime, term premium, and auction metric — each with current data, charts, and historical context
- real-time monitoring via custom alerts for yields, slopes, and curve regime changes (paid feature)
Who uses yieldcurve.pro?
- portfolio managers tracking duration positioning and curve strategies
- fixed-income traders monitoring auction results and curve dynamics
- quantitative analysts researching level-slope-curvature decomposition
- students and academics studying interest rate history and monetary policy
- financial journalists illustrating rate stories with accurate historical context
Tools and Resources
Rates:
- Curves - Compare yield curves across any two dates, with presets for major market events.
- Forwards - Chart implied forward rates derived from the US Treasury par yield curve. Compare spot and forward curves to assess market expectations for future interest rates.
- Levels - Track US Treasury yields by maturity over time. Compare 3 Mo, 2 Yr, 10 Yr, and other tenors across any date range with interactive charts.
- Slopes - Chart Treasury yield curve spreads like 2s10s and 10Y-3Mo over time. Track inversions, recession signals, and slope trends with interactive charts.
All charts can be downloaded as SVG or PNG for presentations and publications.
Monitor:
- Auctions - Explore US Treasury Bill, Note, and Bond auction results. Track bid-to-cover ratios, tail, and bidder allocations with letter grades and interactive charts.
- Inflation - CPI and Core CPI year-over-year rates with 5 Yr and 10 Yr TIPS breakeven inflation expectations.
- Premia - ACM term premium decomposition: expectations vs. risk compensation.
- Regimes - Classify interest rate environments (Bull/Bear Steepener/Flattener).
All charts can be downloaded as SVG or PNG for presentations and publications.
Library:
- Blog - Commentary on US Treasury rates, Fed policy, and yield curve dynamics with auction analysis, regime detection, and curve similarity research.
- Books - Curated reading list on fixed income, yield curves, and quantitative finance. Recommended books for bond market practitioners and investors.
- Learn - A yield curve glossary covering fixed-income concepts, trading strategies, and monetary policy.
- News - Curated fixed-income and macro news feed. Articles from trusted RSS sources scored for relevance to the yield curve, Treasury markets, and quantitative investing.
- Papers - Curated collection of academic and industry research papers on yield curve analysis, term structure, fixed-income, and capital markets. Free to access.
Tools:
- Duration - Calculate modified duration, Macaulay duration, DV01, and convexity for US Treasury bonds.
- Rolldown & Carry - Calculate carry, rolldown, and total return across all Treasury maturities for a given holding period.
- Scenarios - Simulate rate shocks on the yield curve and see price impact across all Treasury maturities.
Services:
- Alerts - Set email alerts when Treasury yields, slopes, or levels cross your thresholds. Alerts fire once and consume one credit.
- API - Fast programmatic access to yield curve data, auction results, and FOMC decisions with a built-in sandbox.
- Odds - Prediction market implied probabilities for Treasury yields and rate spreads.
- SweePro - Systematic T-bill allocation research with historical track record and monthly Treasury commentary for short-duration cash.
Account Features (Free):
- Dashboard - Daily summary snapshot with overnight moves, spread alerts, near-trigger warnings, and full market conditions.
- Defaults - Personalize your yieldcurve.pro experience. Save preferred tenors, lookback periods, and regime settings that apply across all related charts.
- Newsletter - Weekly email digest covering US Treasury yield curve developments, auction results, regime changes, and fixed income market commentary.
How to Use This Site
The sections below provide detailed guides for each tool, including operating instructions, use cases, and recommended workflows. All tools work directly in your browser—no login required for basic features.
If you find this site useful, please consider supporting our caffeine habit via the donation link.
Contact
Disclaimer
yieldcurve.pro is an educational resource. Nothing on this site constitutes financial, investment, or tax advice. All tools, data, and analysis are provided for informational purposes only. Consult a qualified professional before making investment decisions.
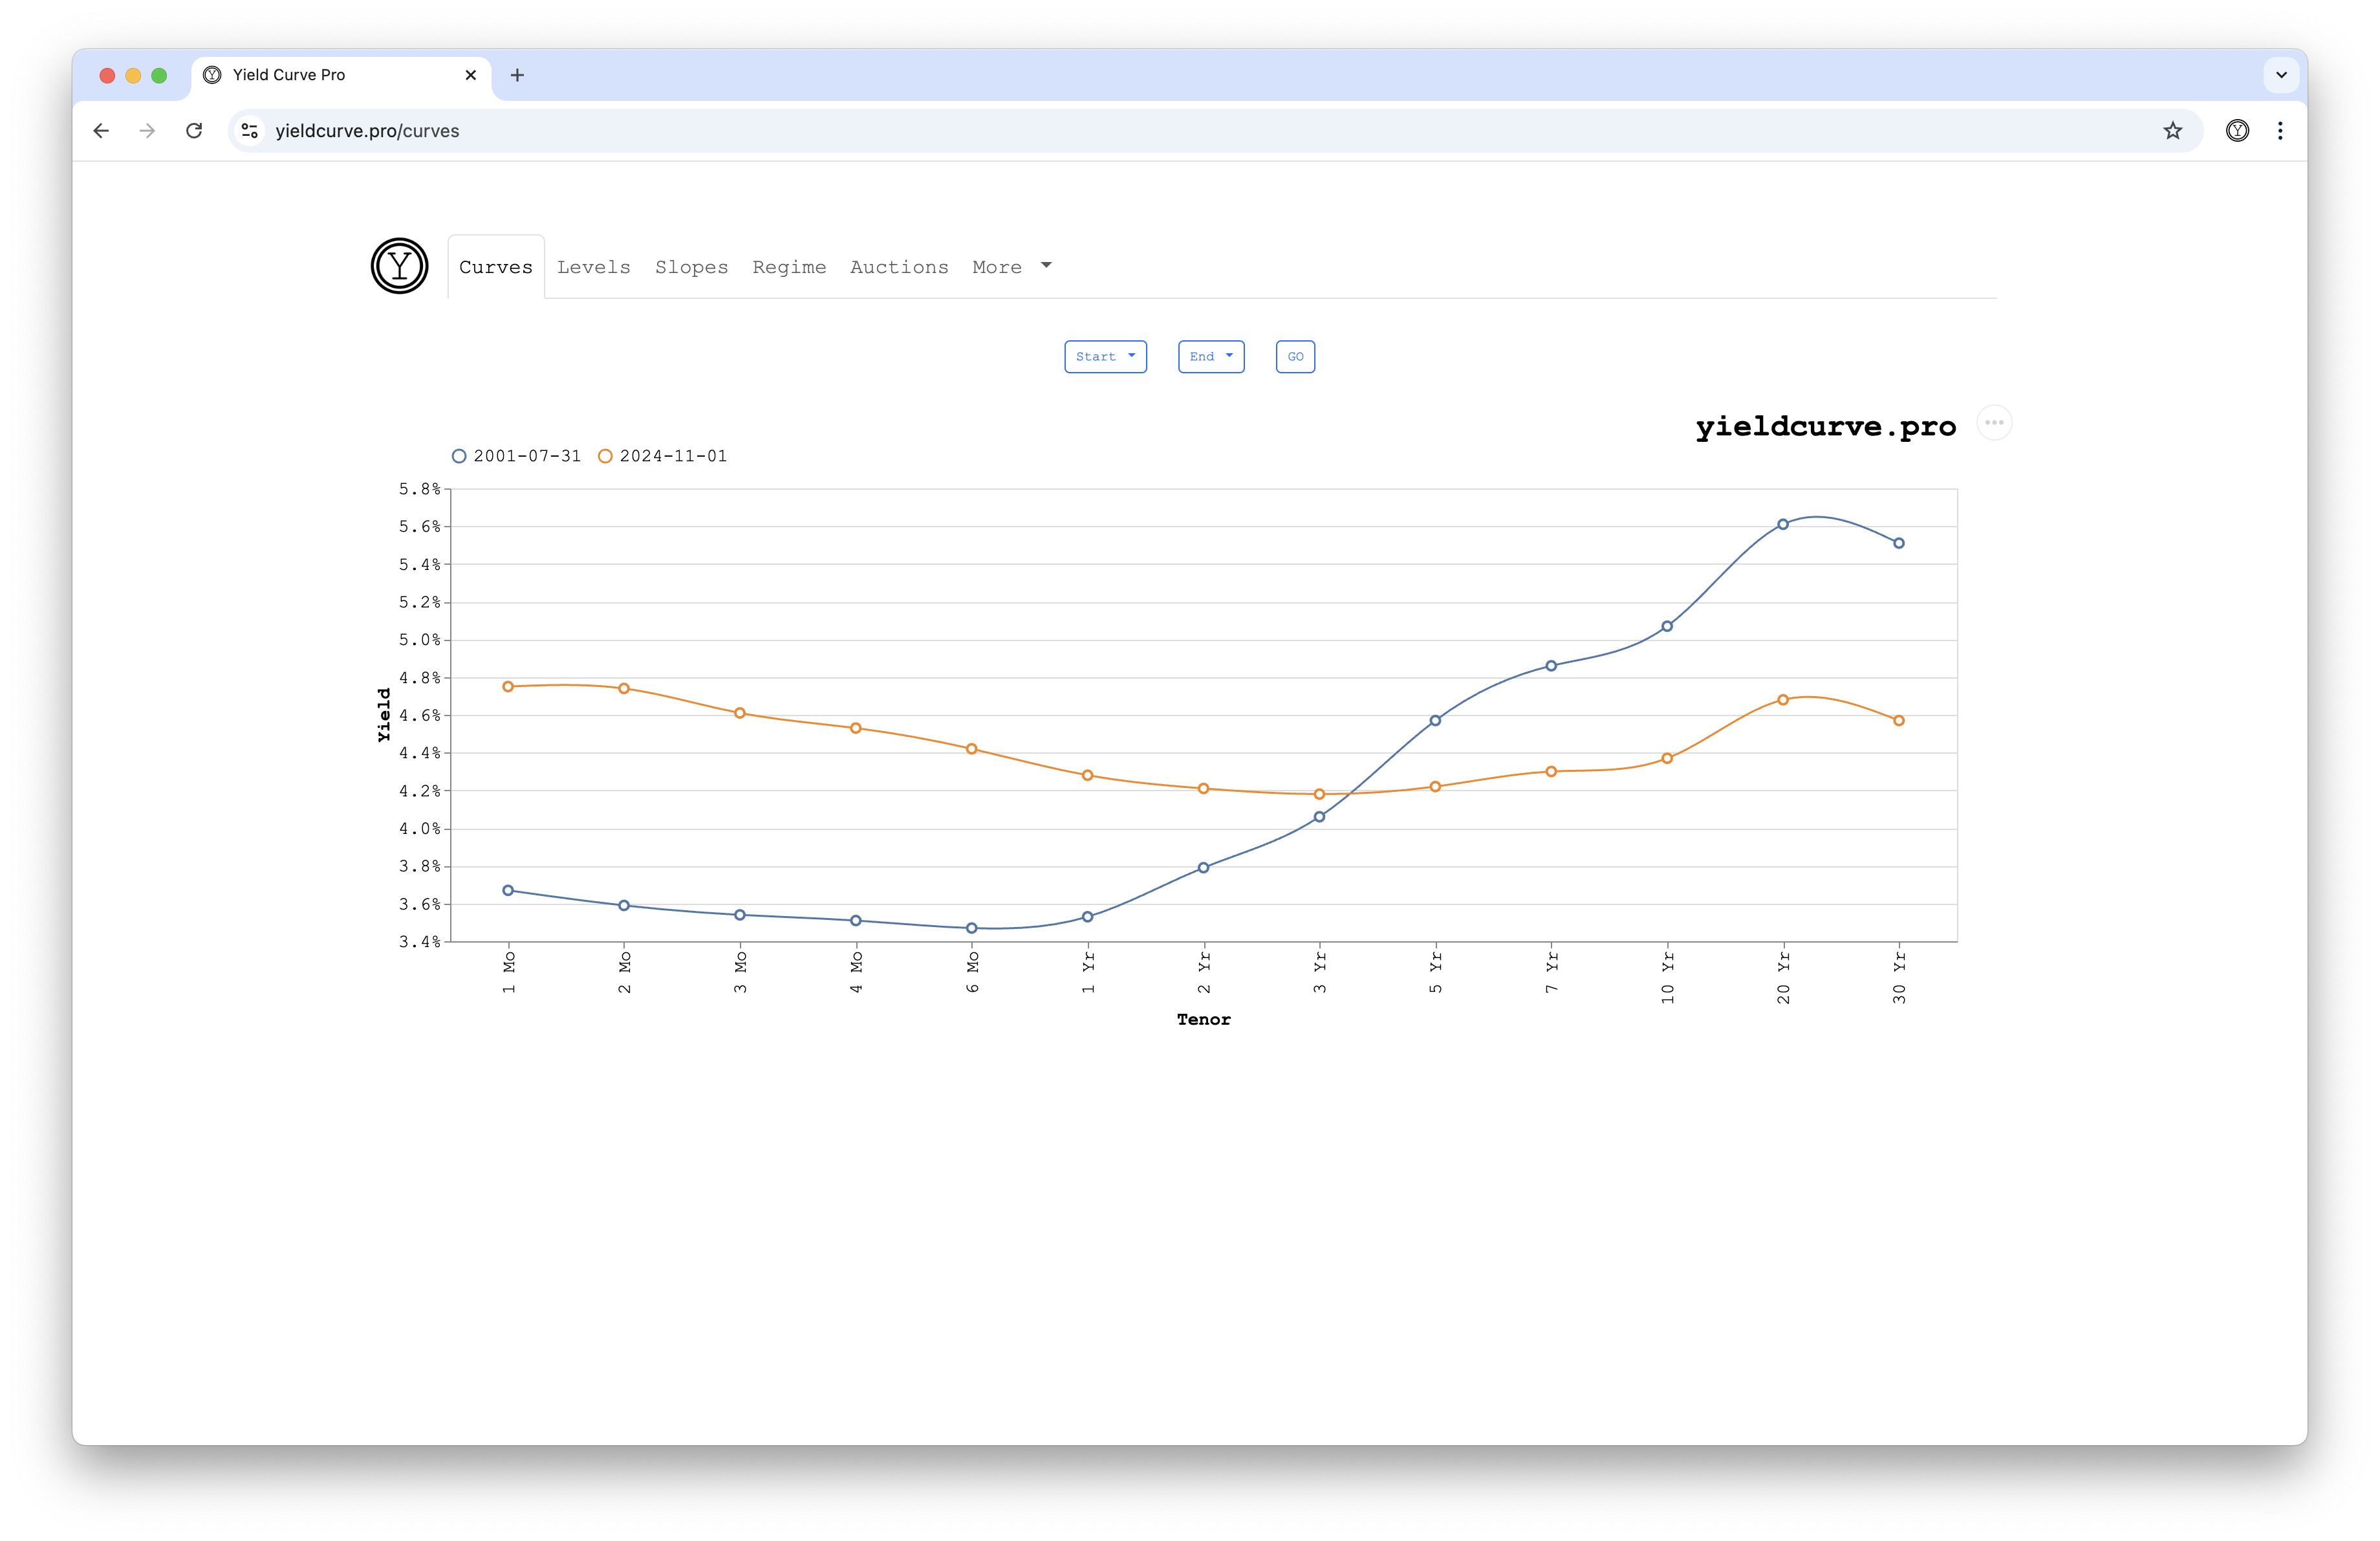
Curves
This app allows users to chart Treasury yield curves, as a function of tenor, for two distinct dates.
Instructions
- choose the desired Start and End dates using the two date selectors — the chart updates automatically
- optionally select from the Events dropdown to load a preset historical date
- click the sparkle button to open ChatYCP and ask questions about the data (login required)
Notes
- Start and End are pre-populated with the earliest and latest dates available, respectively
- Events provides preset dates for significant market events
- each preset has a dedicated URL for easy sharing (e.g., /curves/lehman)
- try asking ChatYCP: "What is the current 10Y yield?" or "What was the yield curve shape on September 15, 2008?"
Preset Events
- 2001 Post-9/11 - First trading day after the September 11 attacks
- 2003 Fed Funds 1% - Trough of post-dot-com easing cycle (very steep curve)
- 2006 Tightening Peak - Fed funds at 5.25% (classic late-cycle inversion)
- 2008 Lehman Bankruptcy - Acute financial crisis (curve shape in chaos)
- 2008 ZIRP Begins - Fed cuts to 0-0.25% (Zero Interest Rate Policy)
- 2011 Operation Twist - Fed program to flatten curve by selling short-term and buying long-term Treasuries
- 2020 COVID Crash - Treasury market dysfunction and liquidity crisis
- 2022 Fed Tightening - Start of aggressive rate hike cycle (inversion developing)
- 2023 Deepest Inversion - 10Y-3Mo at -189 bps (most inverted in decades)
- 2023 10 Yr Touches 5% - Term premium resurgence (higher-for-longer peak)
Use Cases
- discover tenors with the highest or lowest yields
- determine dates with upward or downward sloping yield curves
- compare different interest rate environments through time
- quickly compare today's curve to historical events
Further Reading
- Yield Curve
- The Yield Curve as a Leading Indicator
- The Importance of the US Treasury Yield Curve
- Ten Treasury Curve Snapshots That Defined the Modern Era
- The Yield Curve Predicted a Recession That Never Came
- Examining Yield Curve Similarity (Part 1)
- Examining Yield Curve Similarity (Part 2)
- Does The Yield Curve Follow a Cycle?
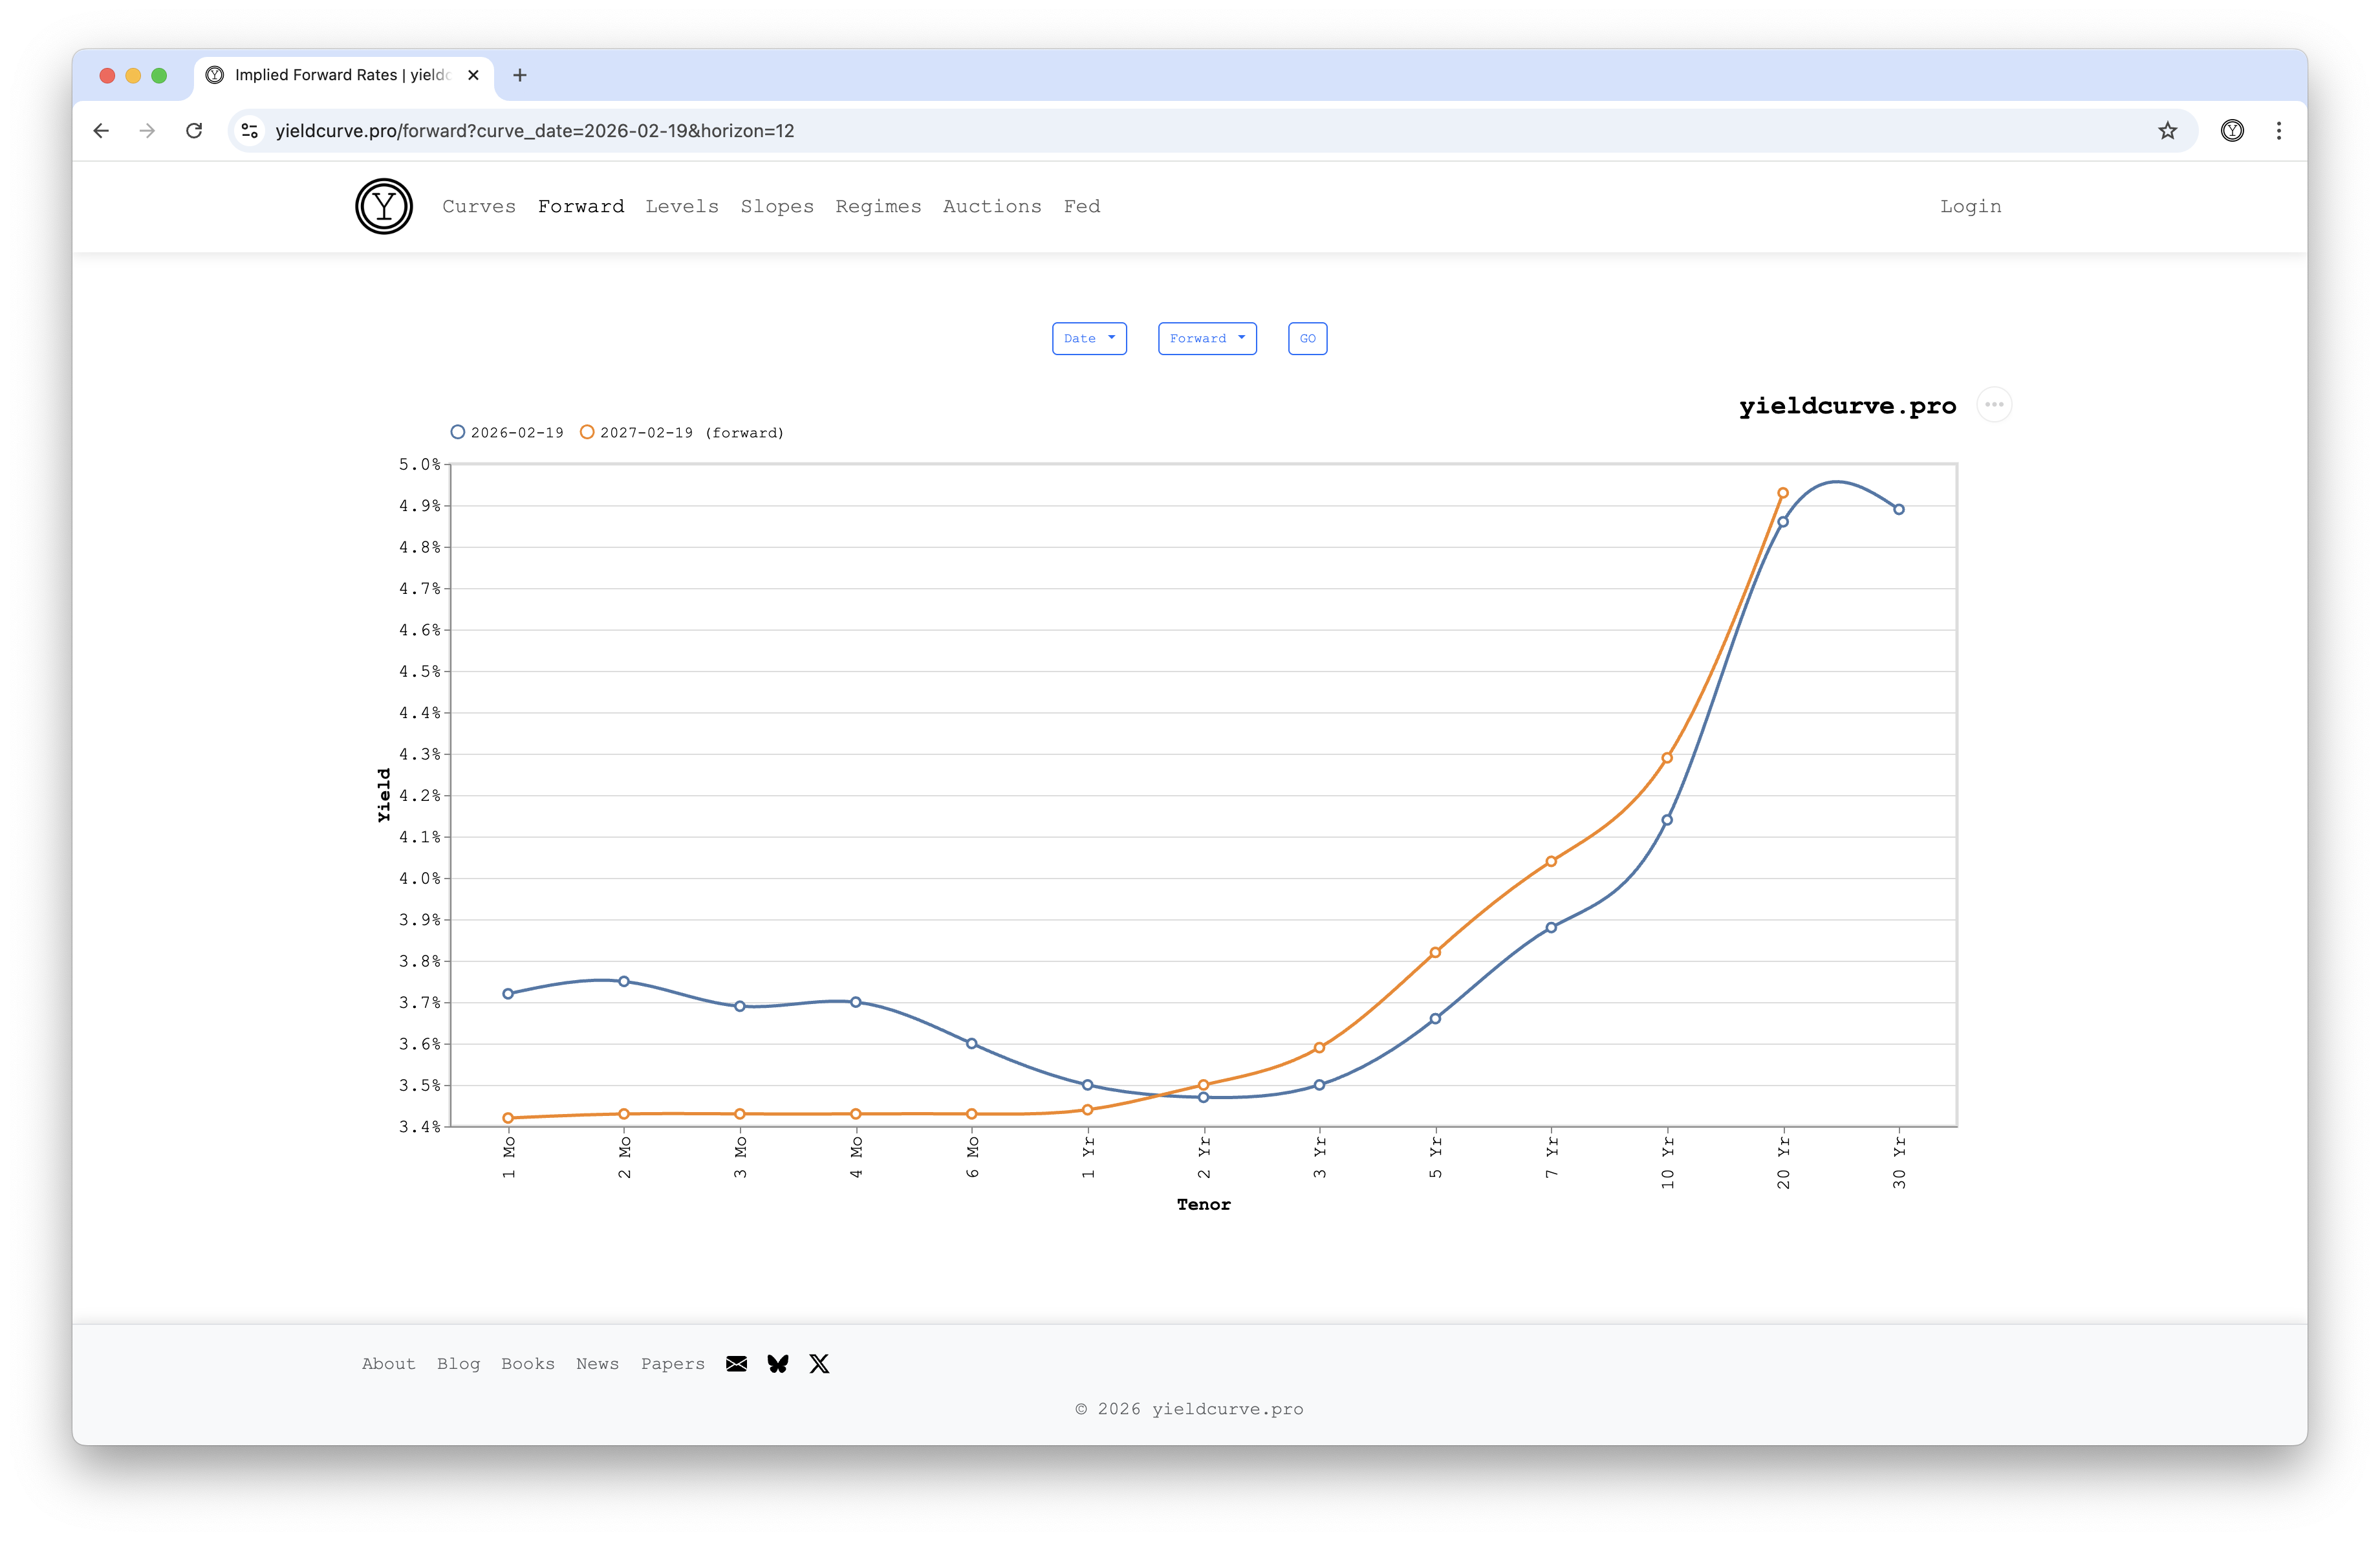
Forwards
This app allows users to explore implied forward rates derived from the US Treasury par yield curve. Forward rates represent the market's implied future interest rates under no-arbitrage conditions.
The chart overlays the zero-coupon spot curve against the implied forward curve for the selected horizon. The spot curve is bootstrapped from the par yields shown on the Curves page. Spot rates differ from par yields because par yields embed coupon reinvestment assumptions — the spot rate at each tenor represents the pure discount rate for a single future cash flow. Forward rates can only be correctly derived from spot rates, not directly from par yields.
Instructions
- choose the desired Date using the date selector — the chart updates automatically
- choose the desired Forward horizon (how far into the future) from the dropdown
- click the sparkle button to open ChatYCP and ask questions about the data (login required)
Notes
- Date is pre-populated with the latest available trading day
- Forward defaults to 1 Yr
- try asking ChatYCP: "Is the forward curve above or below the spot curve?" or "What is the 1Y-forward 10Y rate?"
Use Cases
- assess what the market implies about future interest rates
- identify carry and rolldown opportunities along the curve
- compare spot rates to forward rates to gauge term premium
Further Reading
- Forward Rate
- Bootstrapping (Finance)
- How to Read Implied Forward Rates
- Salomon Brothers' 1995 Yield Curve Primer
- Forward Rates as Market Forecasts
- The Yield Curve Predicted a Recession That Never Came
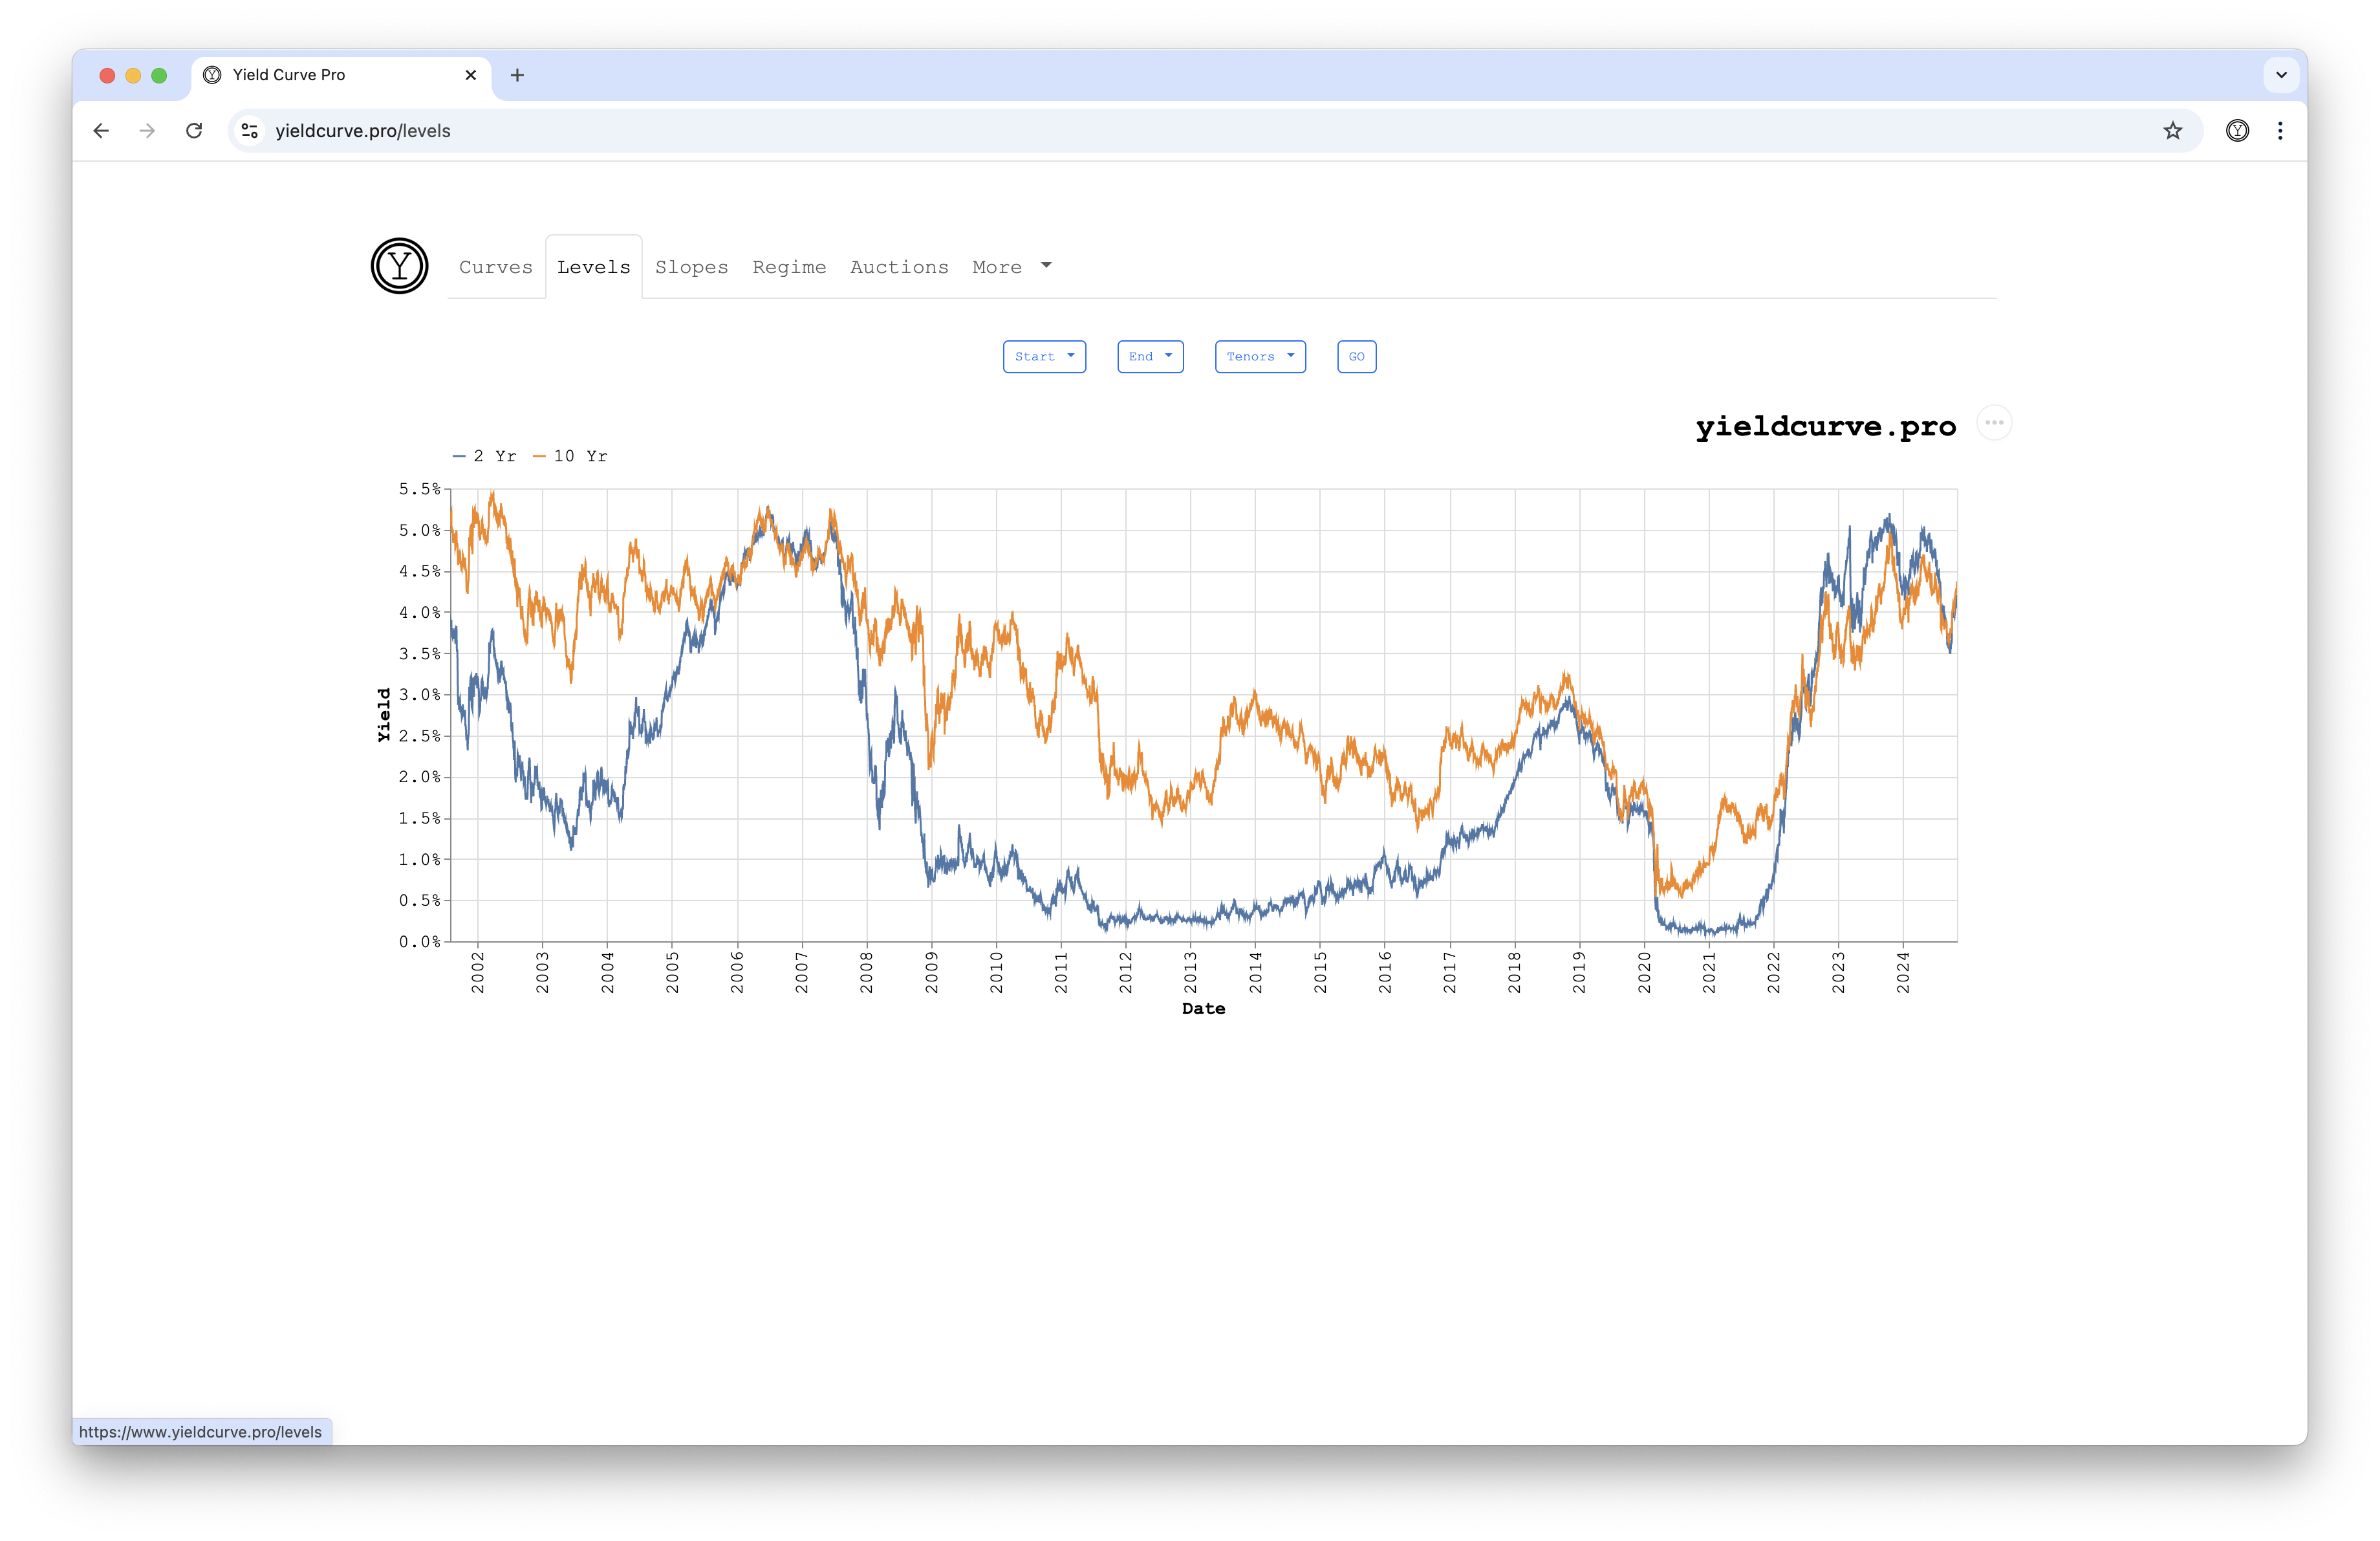
Levels
This app allows users to chart rates for individual tenors as a function of time.
Instructions
- choose the desired Start and End dates using the two date selectors — the chart updates automatically
- select one or more Tenors from the dropdown menu
- click the sparkle button to open ChatYCP and ask questions about the data (login required)
Notes
- Start and End are pre-populated with the earliest and latest dates available, respectively
- Tenor is pre-populated with short and long tenors from user preferences or system defaults (3 Mo and 10 Yr, respectively). Logged-in users can change these via Account Defaults
- try asking ChatYCP: "What is the all-time high for the 10Y yield and when?" or "What was the average 10Y yield during 2023?"
Use Cases
- visualize rates at different tenors as a function of time
- compare tenors cross-sectionally at distinct points in time
- identify high, low, and zero interest rate environments
- gain a sense for the temporal evolution of the overall level of rates
Further Reading
- How has the yield curve moved over the past 25 years?
- US Treasuries
- The Importance of the US Treasury Yield Curve
- The Yield Curve Predicted a Recession That Never Came
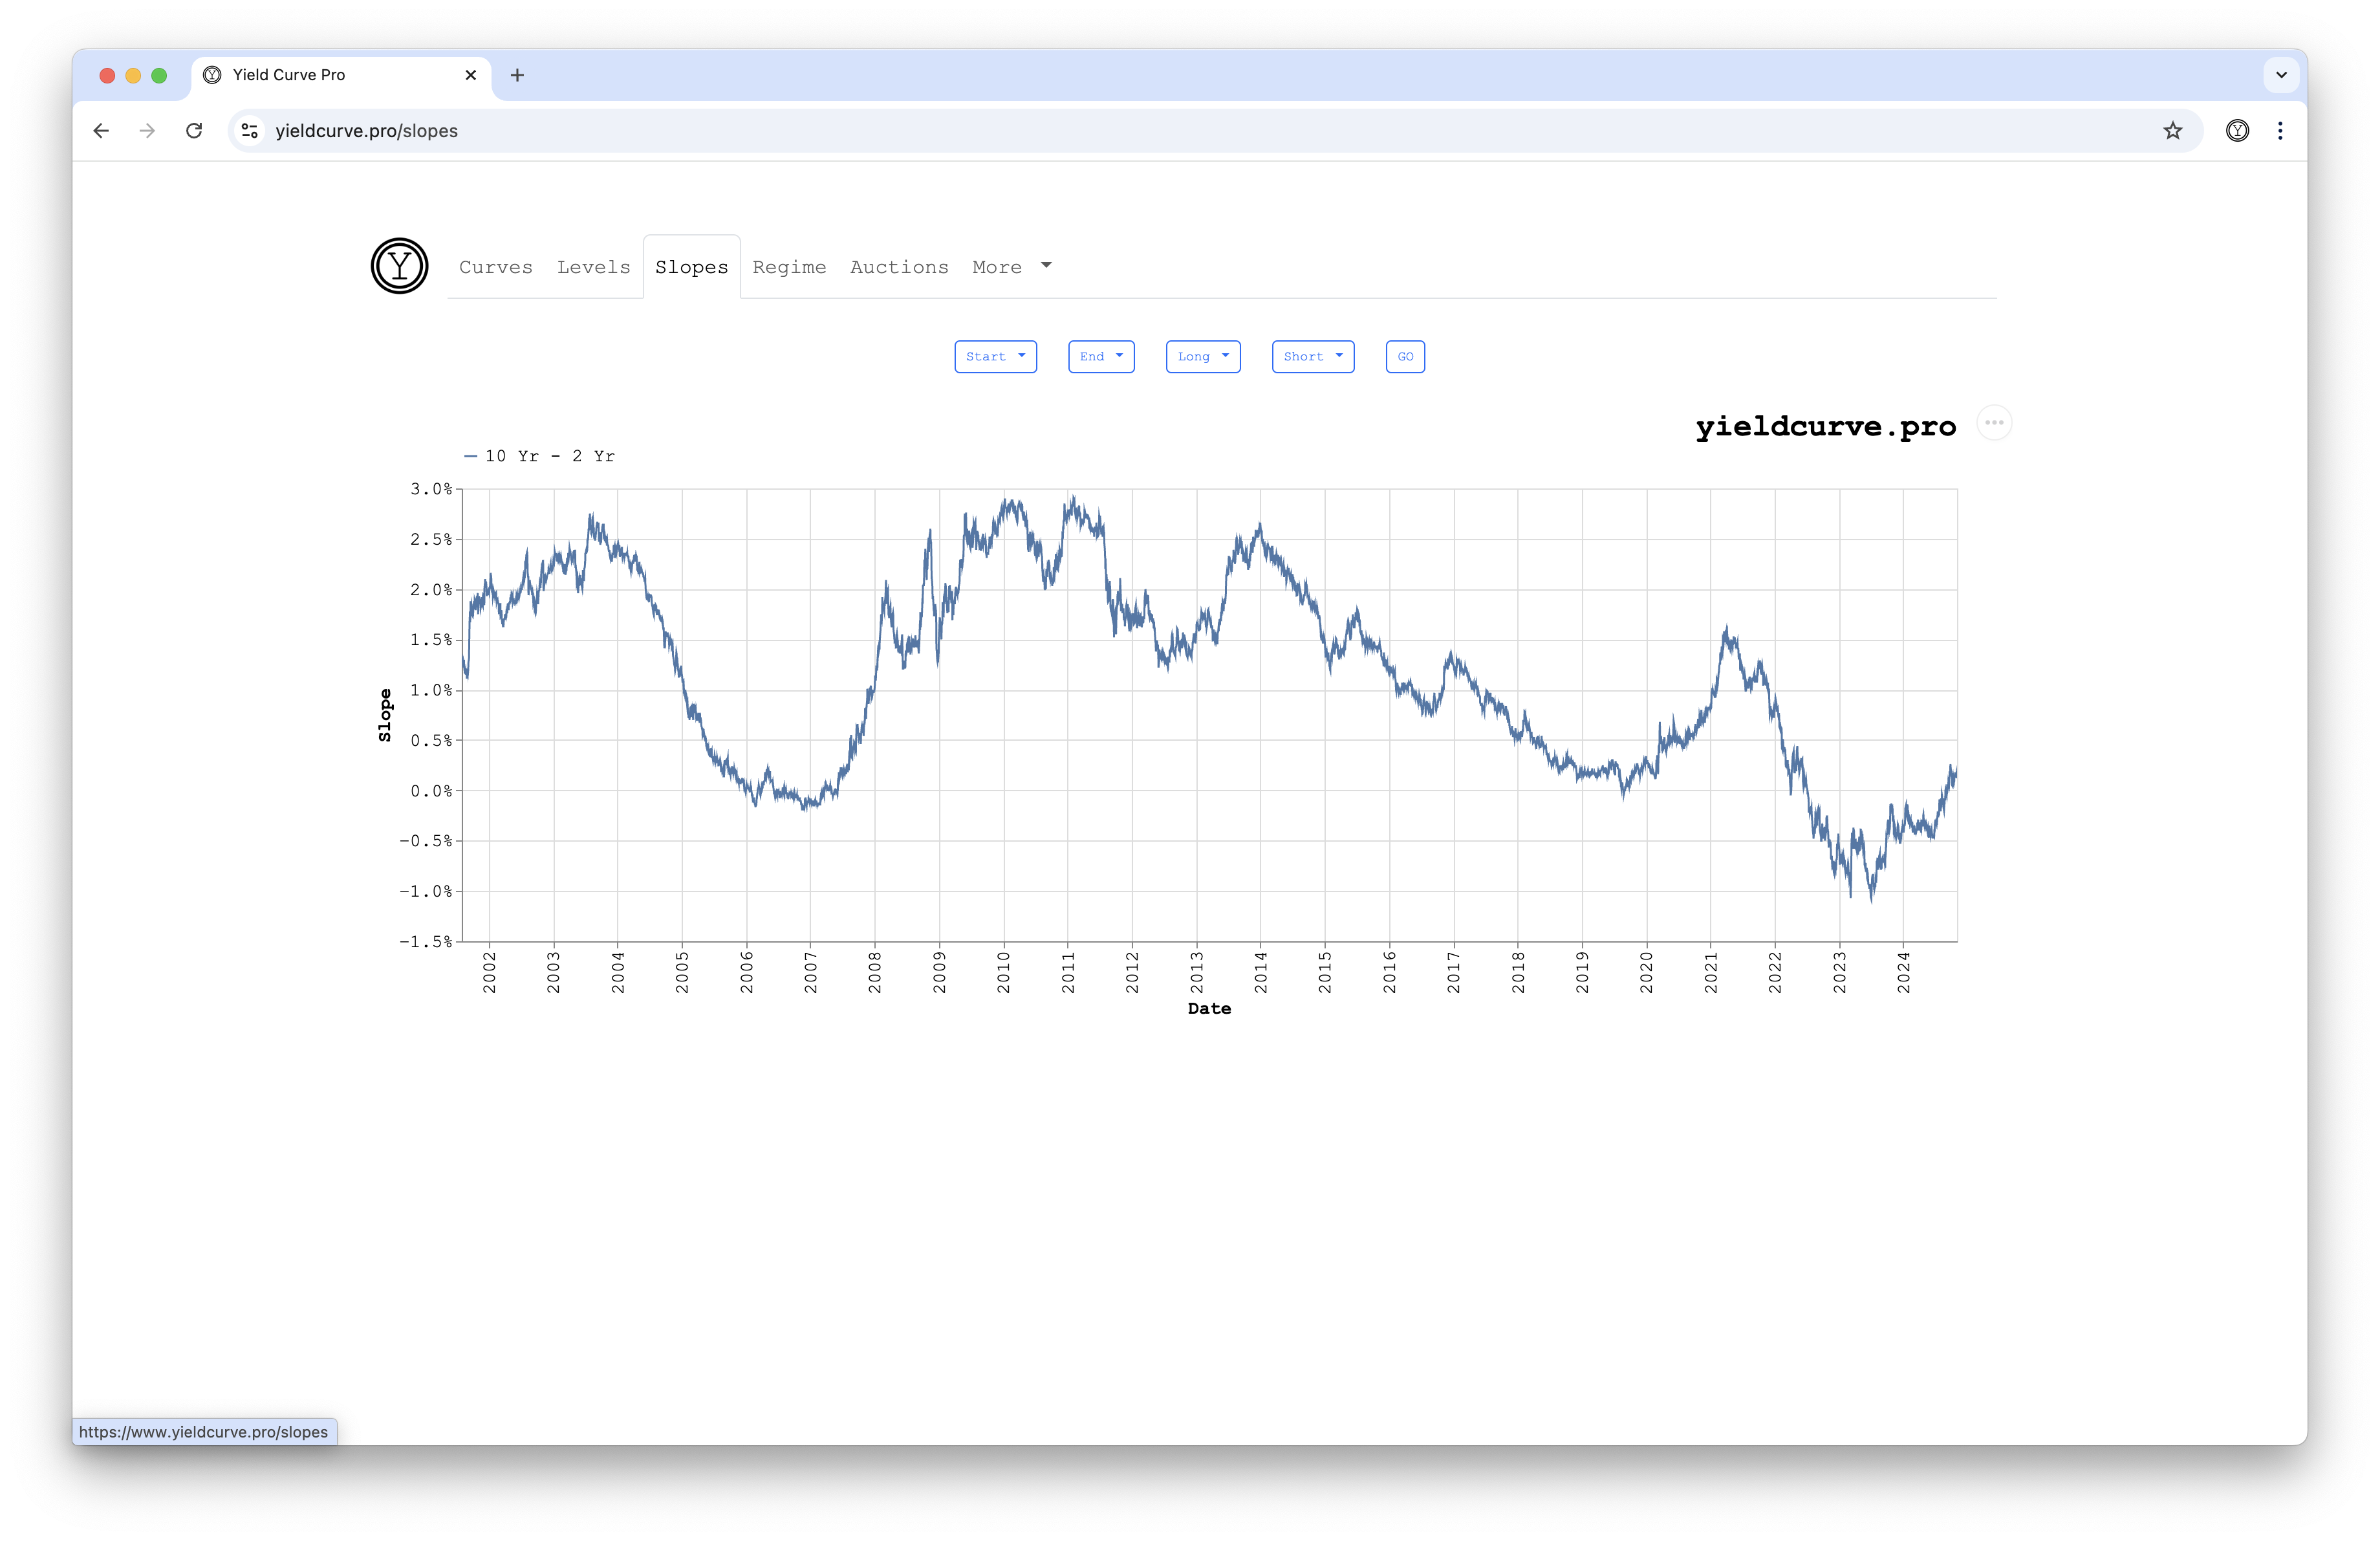
Slopes
This app allows users to chart the difference in rates between two distinct tenors as a function of time. The 10Y minus 2Y difference is the widely tracked 2s10s spread.
Instructions
- choose the desired Start and End dates using the two date selectors — the chart updates automatically
- choose the desired Long Tenor and Short Tenor from the dropdown menus
- click the sparkle button to open ChatYCP and ask questions about the data (login required)
Notes
- Start and End are pre-populated with the earliest and latest dates available, respectively
- Long Tenor and Short Tenor are pre-populated with system defaults (10 Yr and 3 Mo, respectively). Logged-in users can change these via Account Defaults
- try asking ChatYCP: "Is the 10Y-2Y spread currently positive or negative?" or "When was the 10Y-2Y spread most inverted, and what was the value?"
Use Cases
- identify periods of upward or downward sloping yields between two tenors
- estimate the likelihood of economic recession
Further Reading
- Yield Curve Slope
- Why Does the Yield-Curve Slope Predict Recessions?
- The Importance of the US Treasury Yield Curve
- The Yield Curve Predicted a Recession That Never Came
- Does The Yield Curve Follow a Cycle?
Auctions
This app allows users to explore different US Treasury Bill, Note, and Bond auction data.
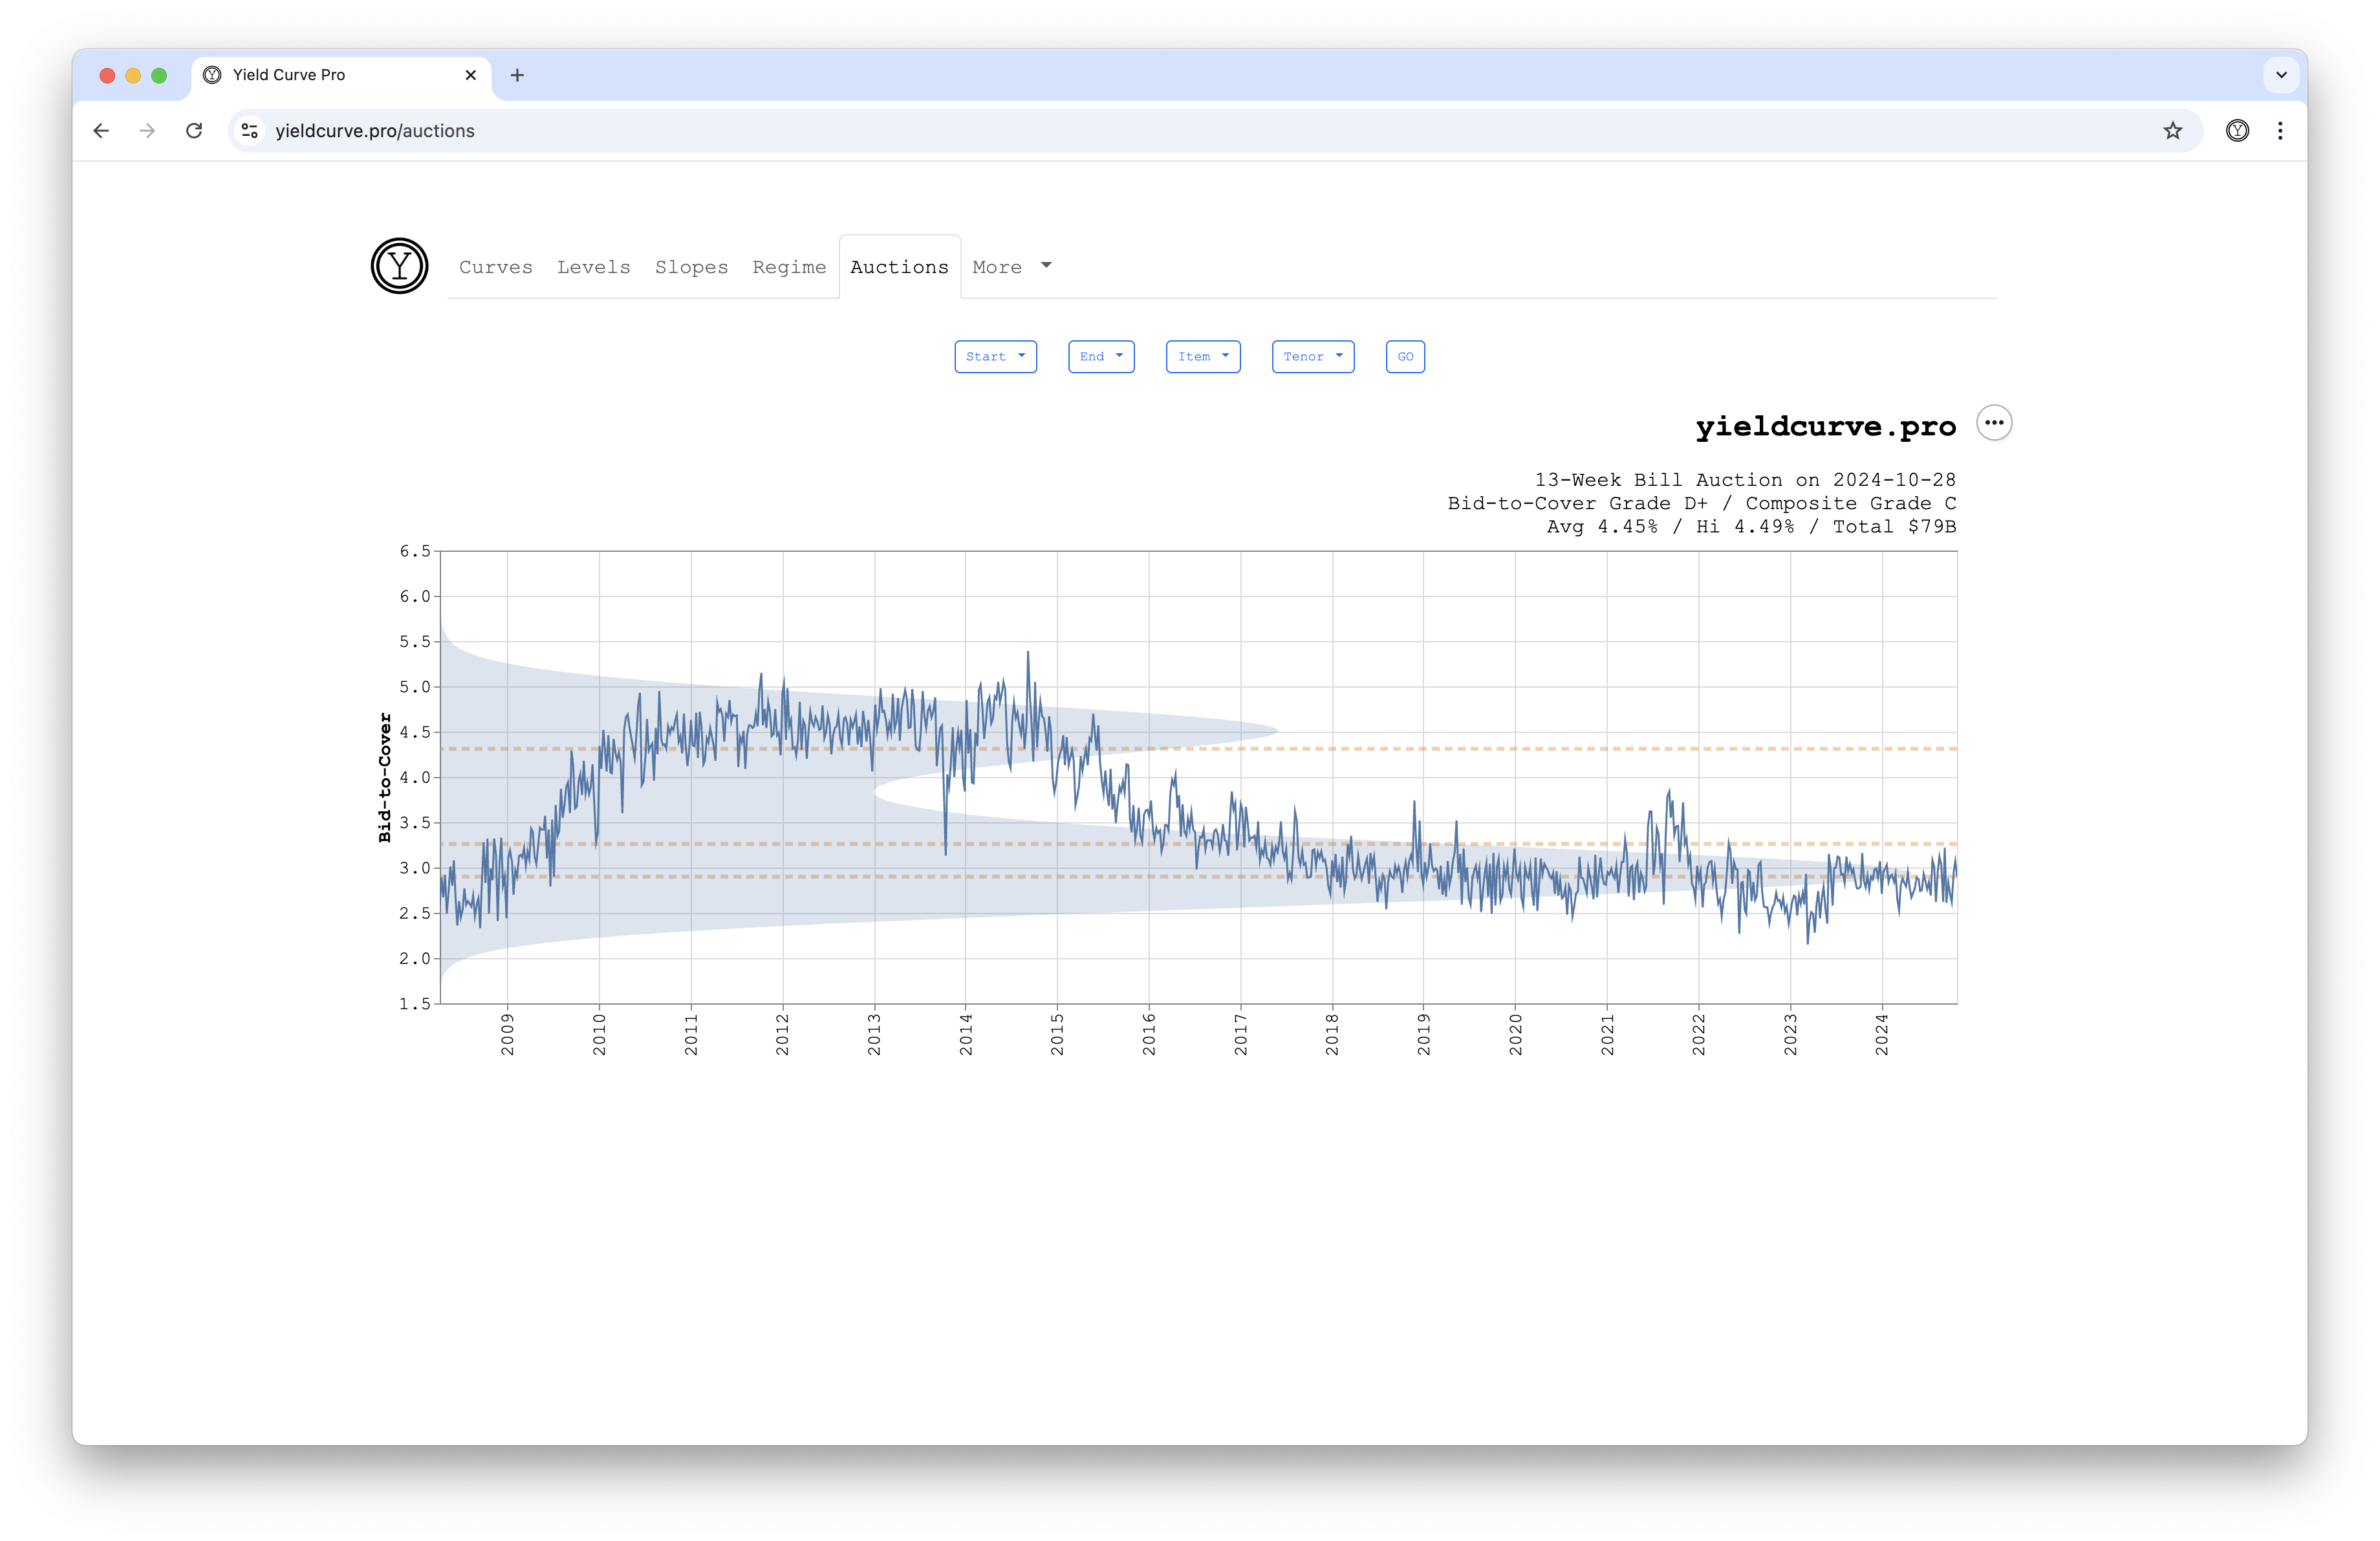
The different data items include
- Tail - This is the difference between the highest and average yield obtained by auction participants (reported in basis points). It is indicative of whether or not all buyers paid a similar price or did some get bonds on the cheap. A small tail relative to history is considered better.
- Bid-to-Cover - This measures the total amount of bids received for a given auction divided by the amount actually sold. Higher relative to history is better.
- Indirect - This is the percentage of competitive bidders (typically foreign central banks and institutions) placing bids through a primary dealer. They participate this way because they are often unable or unwilling to bid directly with the Treasury. Higher relative to history is better.
- Direct - The is the percentage of institutions who are placing bids on the auction directly with the US Treasury. Higher relative to history is better.
Instructions
- choose the desired Start and End dates using the two date selectors — the chart updates automatically
- choose the desired Item from the dropdown menu
- choose the desired Tenor from the dropdown menu
- click the sparkle button to open ChatYCP and ask questions about the data (login required)
Notes
- Start and End are pre-populated with the earliest and latest dates available, respectively
- Tenor is pre-populated with 4-Week
- each Item is given a letter grade (D- to A) relative to the entire history selected by Start and End
- an equally weighted Composite is calculated from the 4 Items
- the most recent Item and Composite grades are show in the chart title as well as Avg and High yields followed by the Total dollar amount auctioned
- try asking ChatYCP: "How was the most recent 10-Year auction?" or "Average bid-to-cover ratios by tenor?"
Use Cases
- identify periods of strengthening or weakening auctions
- determine recent allocations in $ to different tenors
- automate auction analysis with the REST API
Further Reading
- Upcoming Auctions
- Reading Treasury Bond Auctions
- How To Read Treasury Bond Auctions
- How To Read Bond Auction Results
- Treasury Auction Liquidity
- Grading US Treasury Auctions
- How Good Have Recent US Treasury Auctions Been?
Inflation
Charts headline CPI and Core CPI (ex food and energy) year-over-year inflation rates alongside market-implied inflation expectations from TIPS breakeven rates. Use the date picker to zoom into any period.
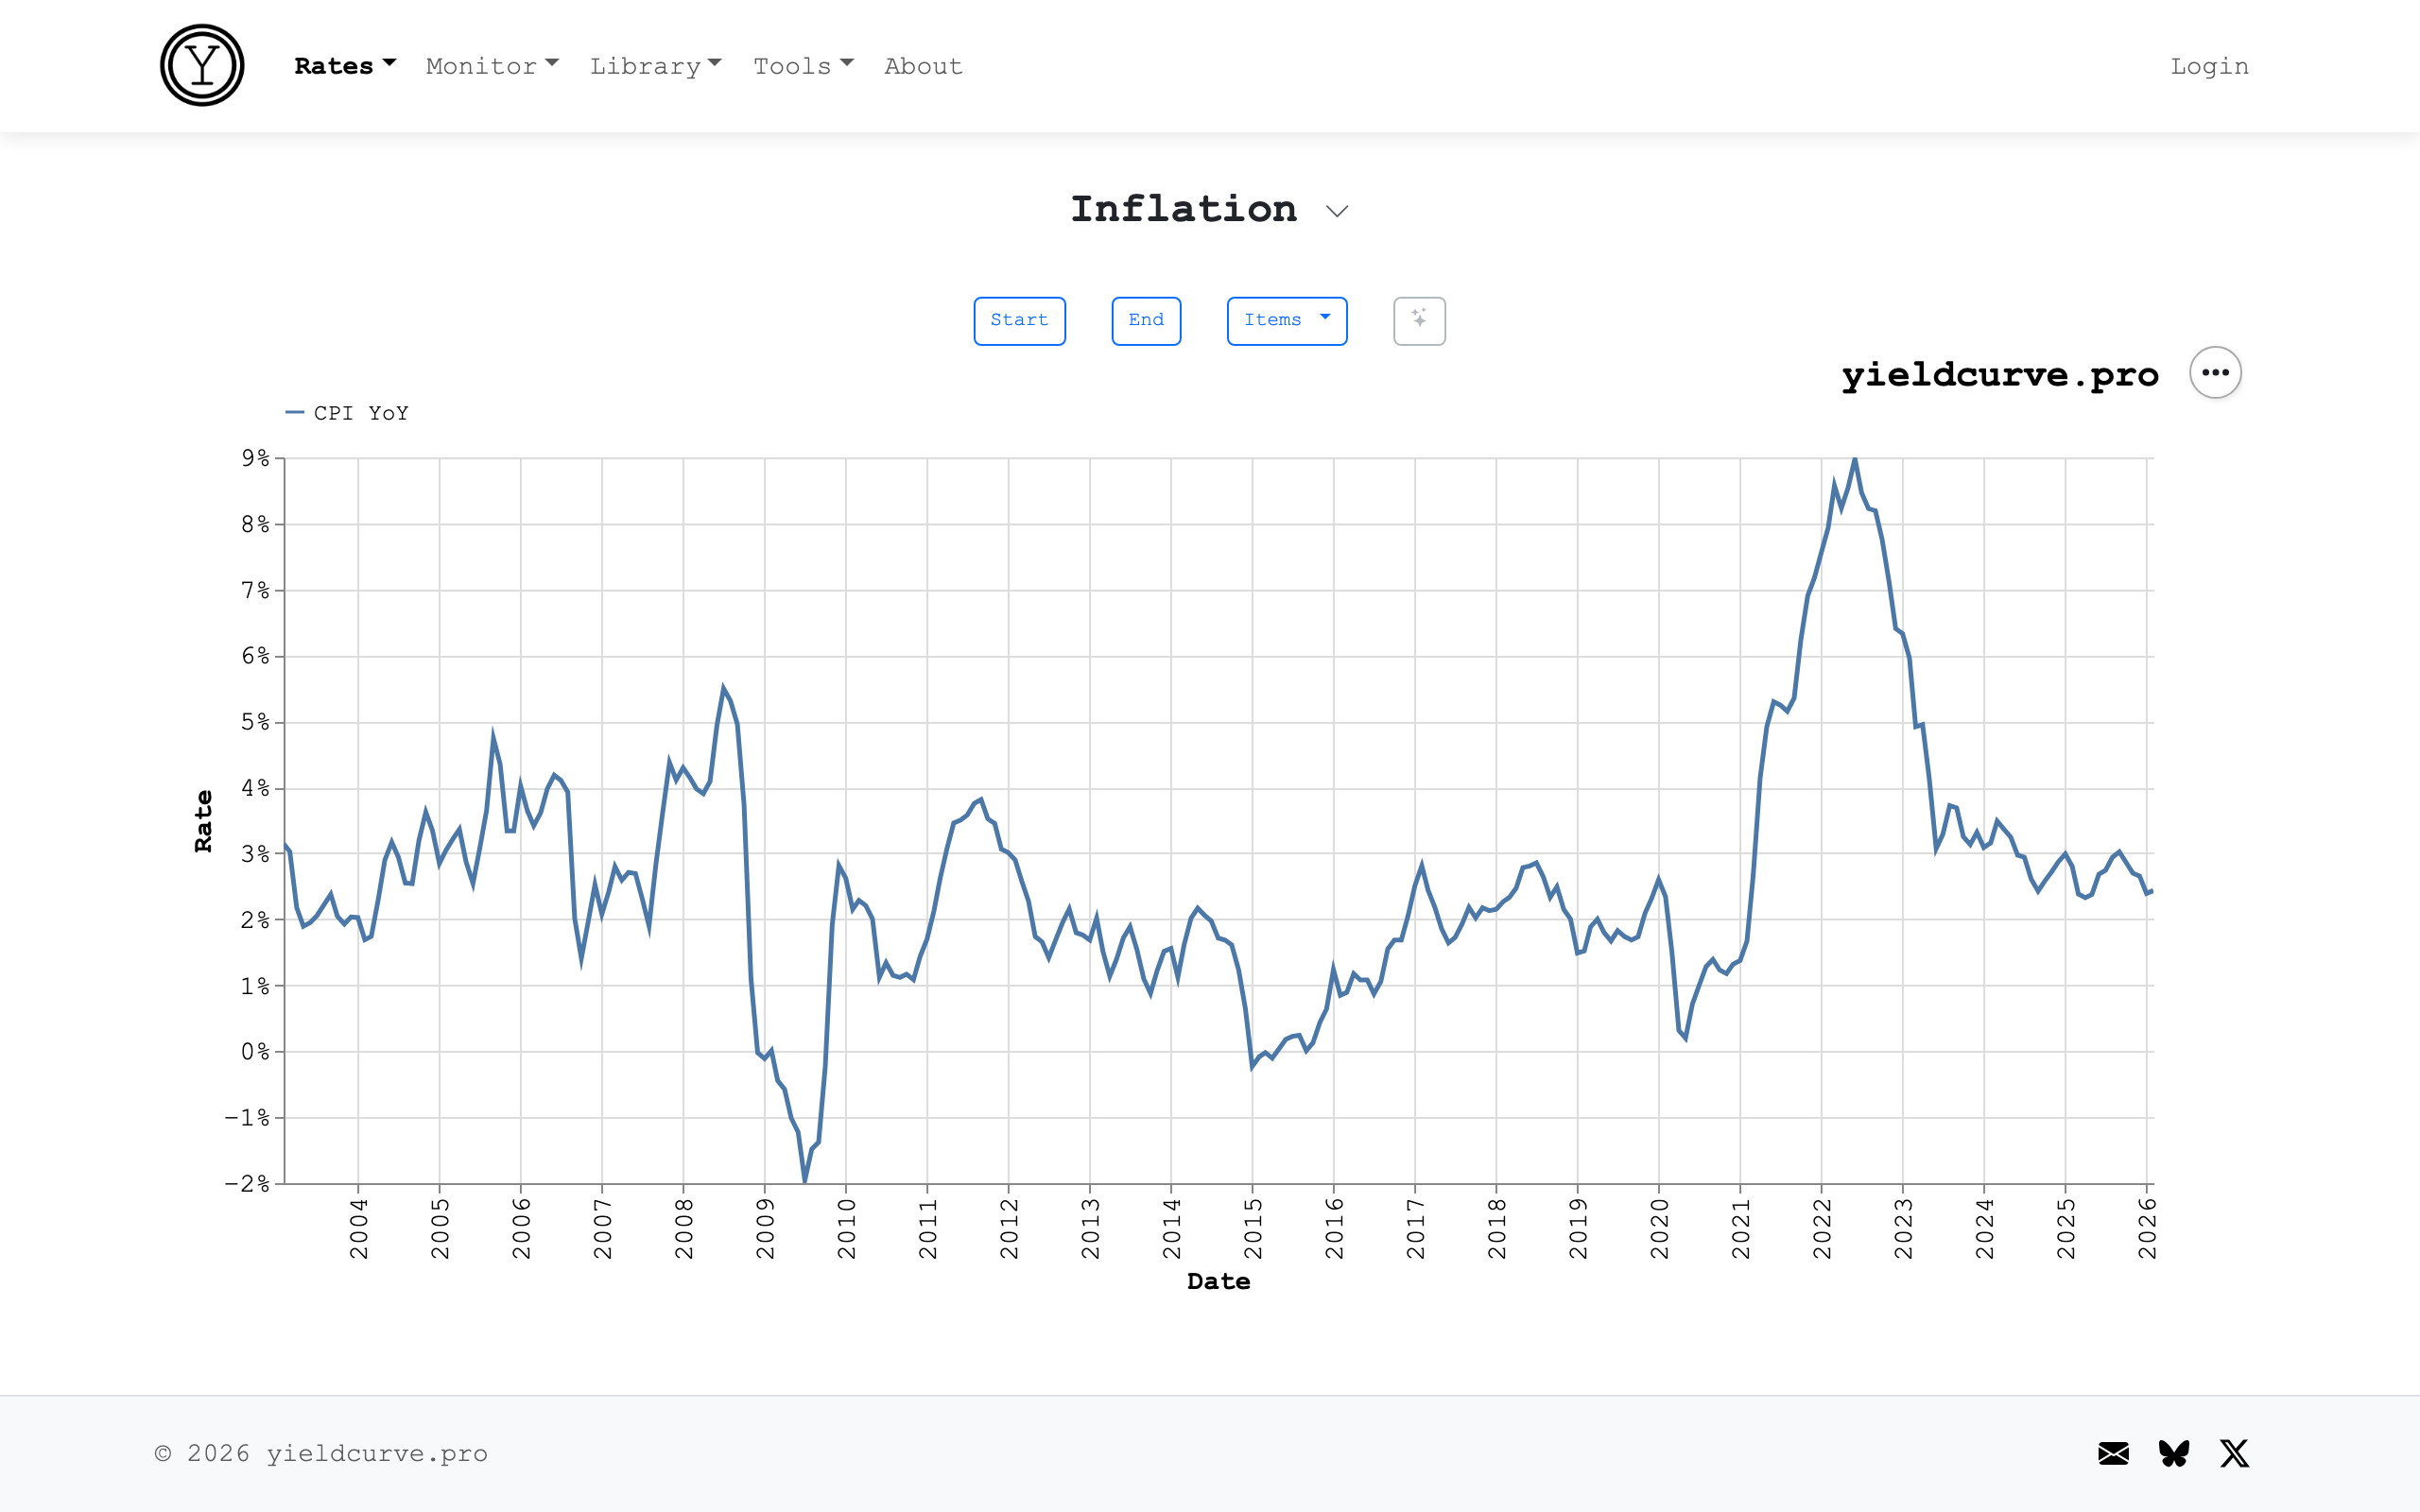
Series
- CPI YoY — headline Consumer Price Index year-over-year change, updated monthly from FRED (series CPIAUCSL)
- Core CPI YoY — CPI excluding food and energy, updated monthly from FRED (series CPILFESL) which is the Fed's preferred measure of underlying inflation trends
- 5 Yr Breakeven — market-implied average inflation over the next 5 years, derived from the spread between nominal Treasuries and TIPS
- 10 Yr Breakeven — same concept over a 10-year horizon
Use Cases
- compare realized inflation against market expectations
- track the gap between headline and core CPI
- monitor inflation expectations for bond portfolio positioning
- identify when breakeven rates diverge from realized inflation
Premia
Every Treasury yield is the sum of two things: what markets expect short-term rates to average over the life of the bond and the extra yield investors demand as compensation for committing capital for longer. That extra yield is the term premium. The decomposition takes the form
$$y_n = \hat{y}_n + \xi_n$$
where
- $y_n$ — observed Treasury yield at tenor $n$
- $\hat{y}_n$ — risk-neutral yield (expected average short rate over the bond's life)
- $\xi_n$ — term premium
The term premium is time-varying and can turn negative. During the Fed's quantitative easing programs (2008–2022), large-scale asset purchases suppressed term premia — long-term yields fell not because rate cut expectations changed, but because the risk compensation demanded by investors collapsed. Understanding which component is driving a yield move is essential for reading monetary policy signals accurately.
This tool estimates term premia using the ACM model (Adrian, Crump, and Moench 2013), the Federal Reserve Bank of New York's official decomposition methodology. It uses a three-step linear regression on principal components of the yield curve to separate the expectations and risk-compensation components at each maturity.

Instructions
- use the View menu to switch between Premia and Components
- in Premia view: select one or more tenors (1Y–30Y) using the checkboxes and a date range; the chart shows each selected tenor labeled as e.g. 10 Yr (premium)
- in Components view: select a single tenor from the dropdown to see the full decomposition — three lines labeled 10 Yr, 10 Yr (expected), and 10 Yr (premium)
- the chart updates automatically when you change dates, tenors, or view mode
- click the sparkle button to open ChatYCP and ask questions about the data (login required)
Notes
- term premia are estimated using all available daily yield curve history
- the model is re-fit after new data arrives and estimates for earlier dates may be revised slightly (normal for time-series models of this type)
- negative term premia indicate that investors accept a lower yield than the expected short-rate path which is common when safe-haven demand or central bank buying compresses risk compensation
- try asking ChatYCP: "Current 10Y term premium?" or "How many days has 10Y TP been negative total?"
- our estimates will run approximately 1–2 percentage points higher than the NY Fed's published ACM series
- the ACM model's VAR learns the unconditional mean short rate from history
- the NY Fed trains on data back to 1961 (including the Volcker-era rates of 5–15%)
- this site uses data from 2001-present, a window dominated by the zero-rate era (2008–2021)
- our VAR estimates that rates mean-revert to roughly 2%, attributing more of the current yield to "premium" and less to "expected short rates"
- the NY Fed's published series is linked below
Use Cases
- parsing yield moves: when the 10Y yield rises, check whether the term premium or the expectations component is driving it (a term-premium rise signals shifting risk appetite, an expectations rise signals a more hawkish Fed repricing)
- monitoring QE/QT impact: term premia compress during asset purchase programs and widen during balance-sheet runoff
- cross-maturity risk structure: compare 2Y vs. 10Y term premia to understand where in the curve investors are demanding the most compensation
- historical context: place today's term premium in context with respect to other periods
Further Reading
- Adrian, Crump, Moench (2013) — Pricing the Term Structure with Linear Regressions
- NY Fed Term Premium Data and Methodology
- Forward Rates as Market Forecasts
Regimes
This app allows users to see which market regime exists as of the selected date. The regime is a result of movements in yields as measured by the Level and Slope components of the yield curve.
The components of the yield curve — Level and Slope — follow the framework of Litterman and Scheinkman (1991) and account for the vast majority of historical yield curve variation. This app uses the following proxy definitions:
- Level = 10 Yr (the general level of rates across the curve)
- Slope = 10 Yr − 3 Mo (the spread between long and short rates)
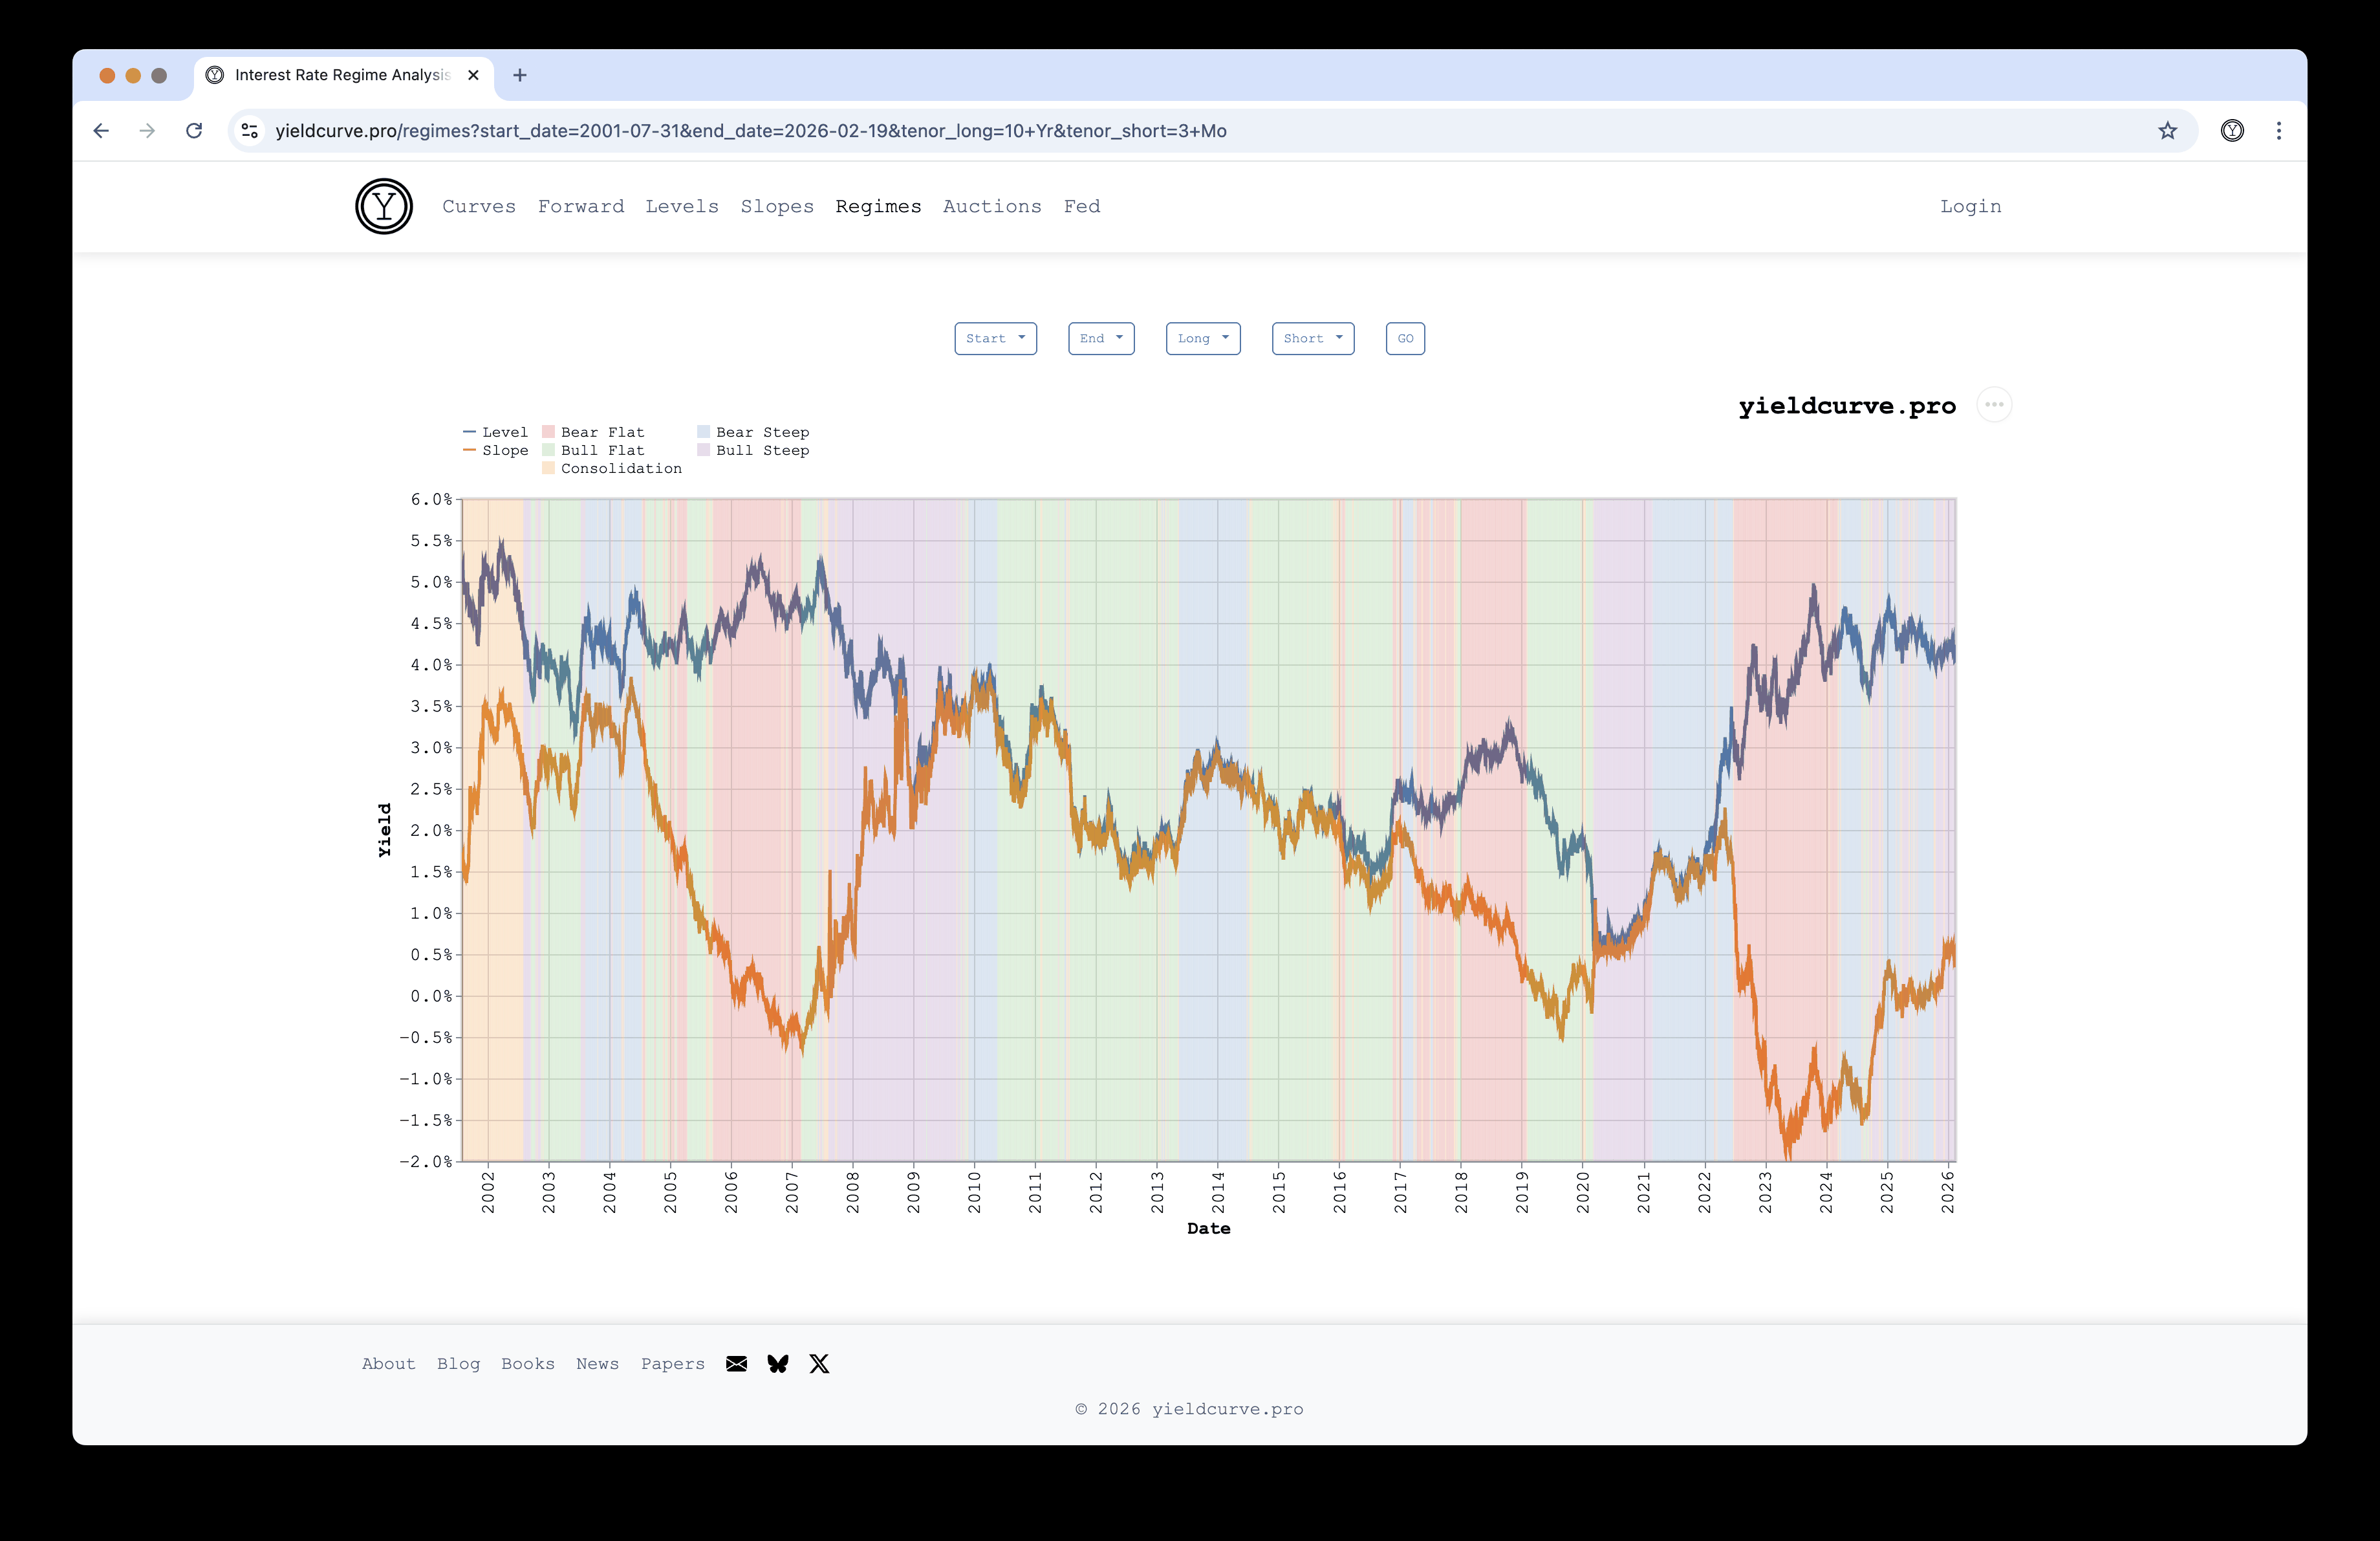
The possible regimes are
- Bull Steep - Level and Slope decreasing and increasing, respectively, characterized by short-term rates falling faster than long-term rates
- Bull Flat - Level and Slope both decreasing, characterized by long-term rates falling faster than short-term rates
- Bear Steep - Level and Slope both increasing, characterized by long-term rates rising faster than short-term rates
- Bear Flat - Level and Slope increasing and decreasing, respectively, characterized by short-term rates rising faster than long-term rates
- Consolidation - either the change in Level or Slope is below 5 bps over the lookback window, indicating no clear directional signal
Changes in Level and Slope are computed relative to a lookback window. The system default is 251 market days.
Instructions
- choose the desired Start and End dates using the two date selectors — the chart updates automatically
- choose the desired Long Tenor and Short Tenor from the dropdown menus
- click the sparkle button to open ChatYCP and ask questions about the data (login required)
Notes
- Start and End are pre-populated with the earliest and latest dates available, respectively
- Long Tenor, Short Tenor, and Lookback are pre-populated with system defaults (10 Yr, 3 Mo, and 251 days, respectively). Logged-in users can change these via Account Defaults
- try asking ChatYCP: "What is the current yield curve regime?" or "How many regime transitions occurred in 2024?"
Use Cases
- selecting the best asset classes for a given regime
- risk management and hedging
- economic analysis and forecasting
Further Reading
- Litterman & Scheinkman (1991) — Common Factors Affecting Bond Returns
- Factors in Focus: Are Your Equity Styles Ahead of the Curve?
- Foundations in Factors
- Bears, Bulls, Steepeners, Flatteners, Oh My!
- Asset Returns During Various Yield Curve Regimes
- Does The Yield Curve Follow a Cycle?
Blog
The blog shares commentary on capital markets, interest rates, fixed-income securities, and the yield curve. Posts cover topics ranging from auction analysis to regime detection to yield curve similarity measures.
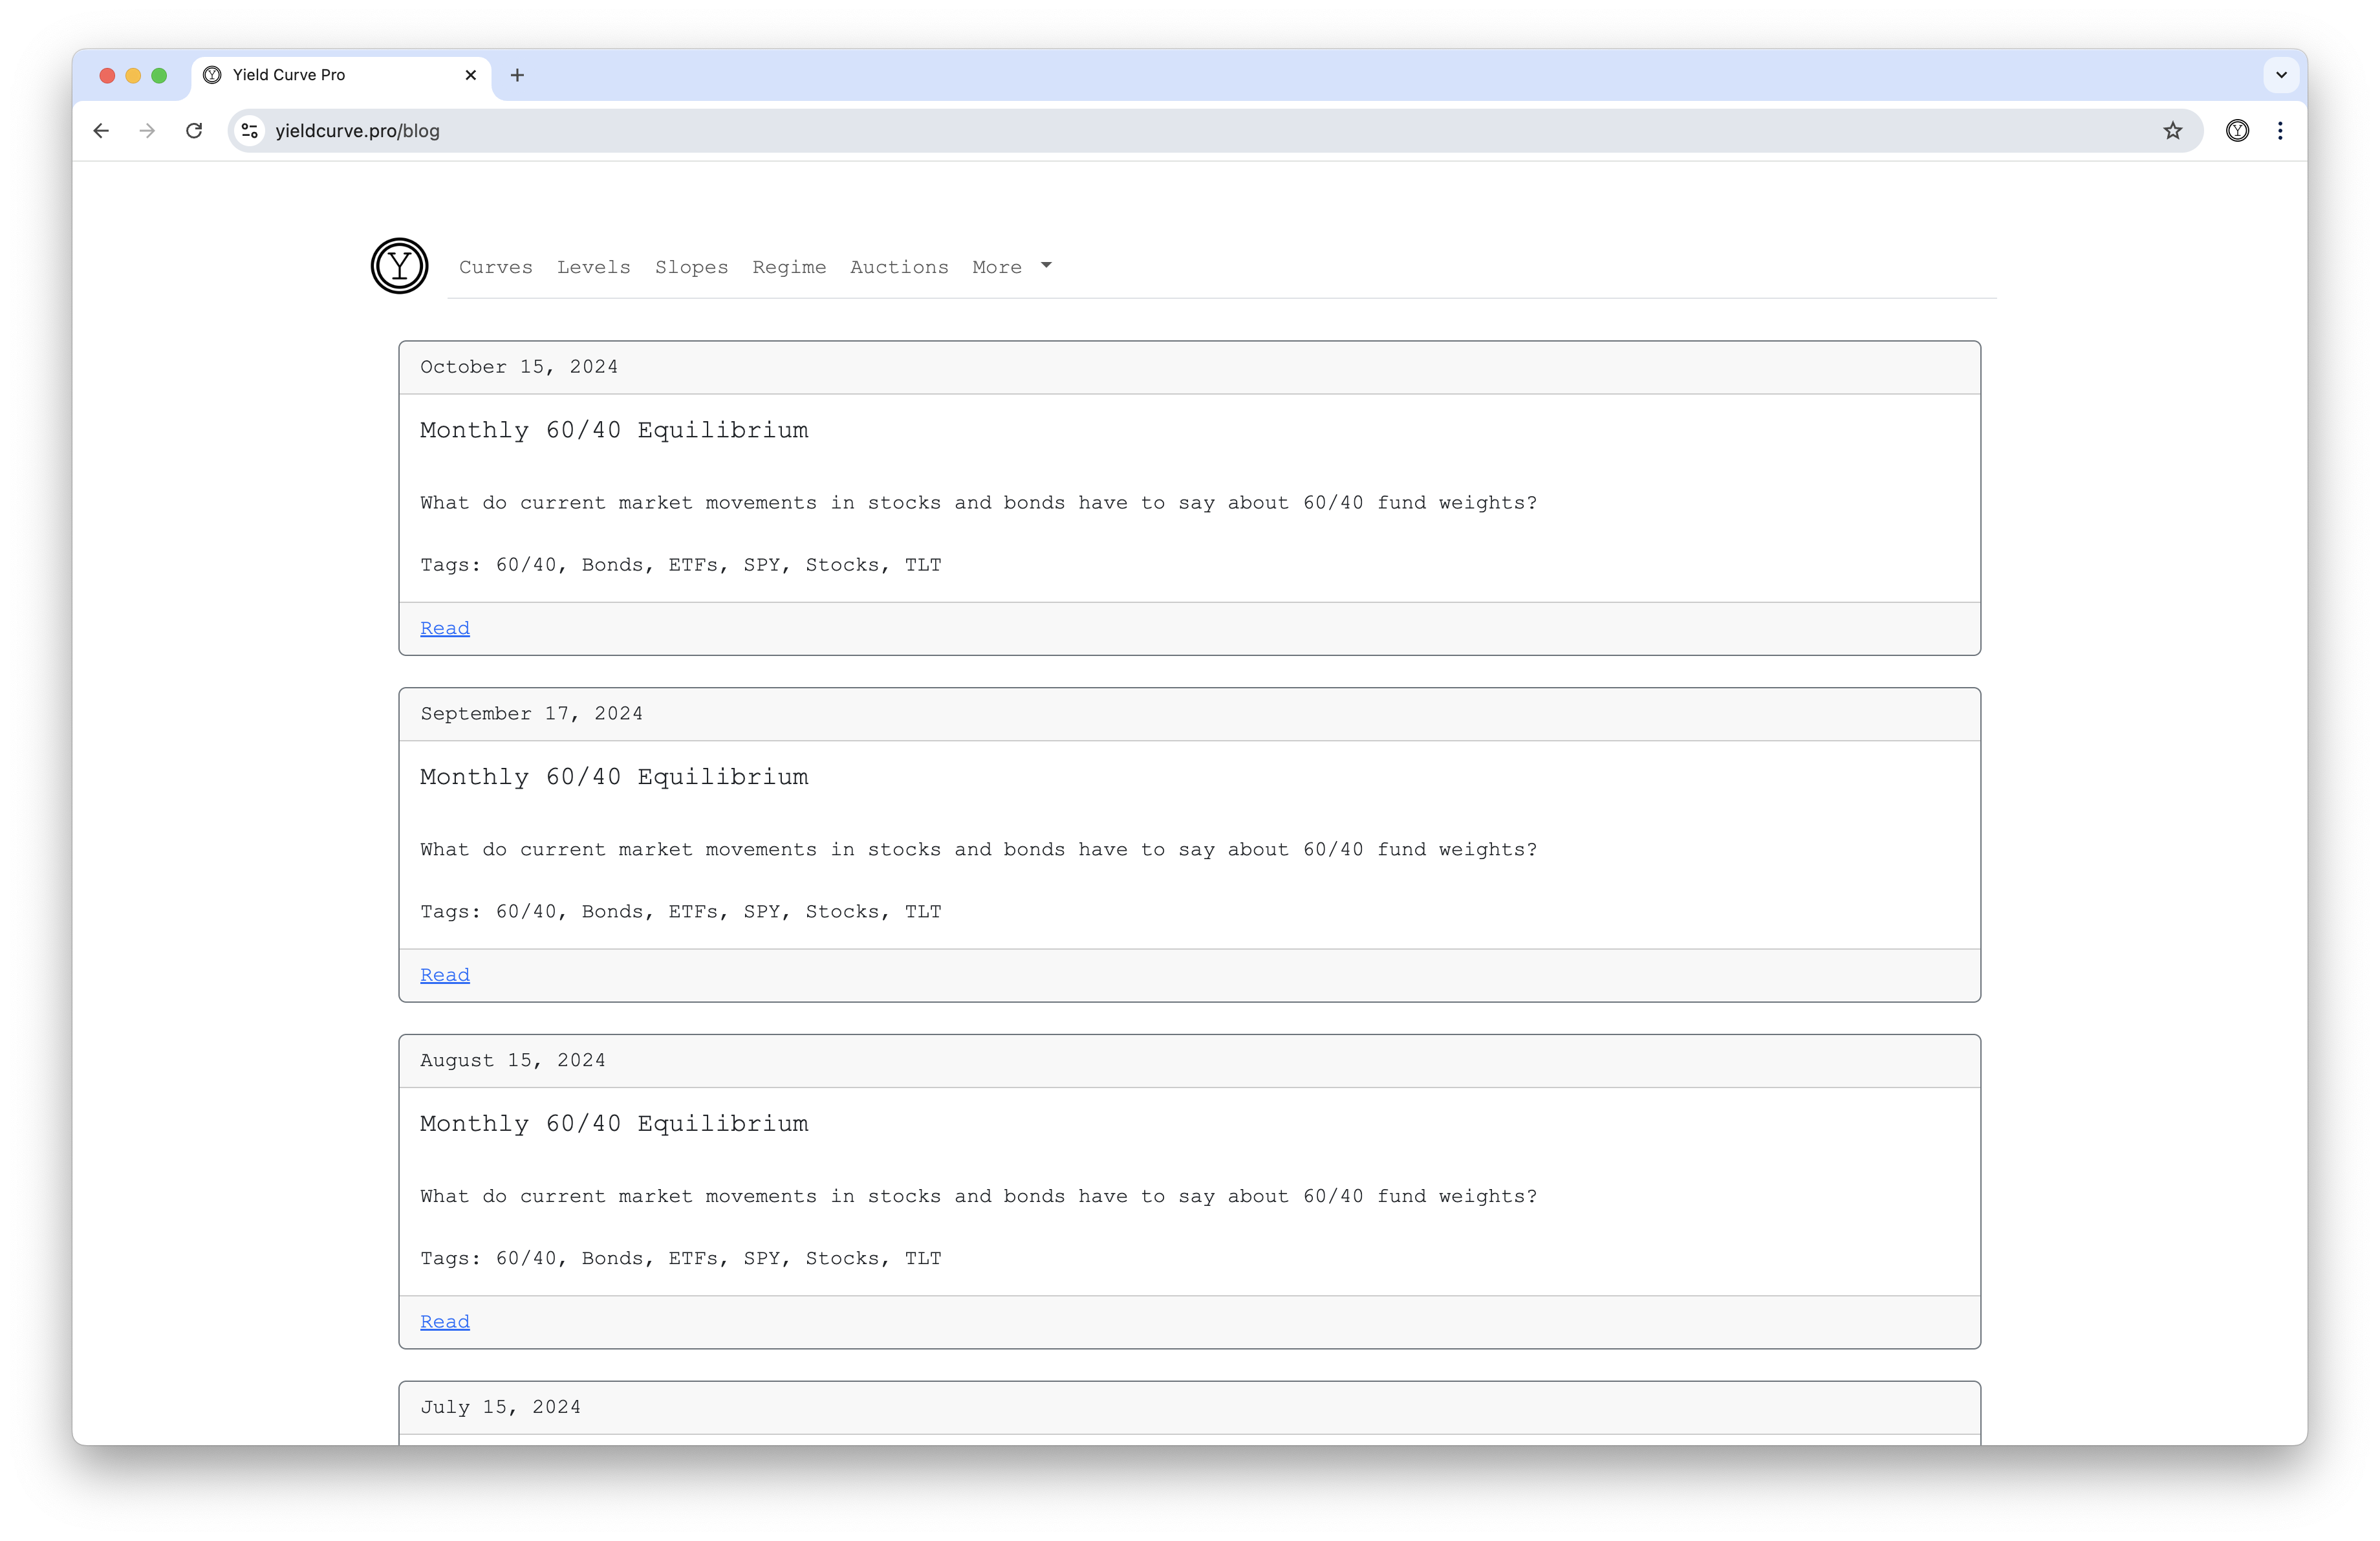
Instructions
- browse posts in reverse chronological order (newest first)
- click Read to view the full post
- use pagination at the bottom to navigate between pages
Notes
- posts are paginated with 3 posts per page
- each post includes tags for easy categorization
- logged-in users can leave comments on individual posts
Books
A curated collection of recommended reading on the capital markets and quantitative finance.
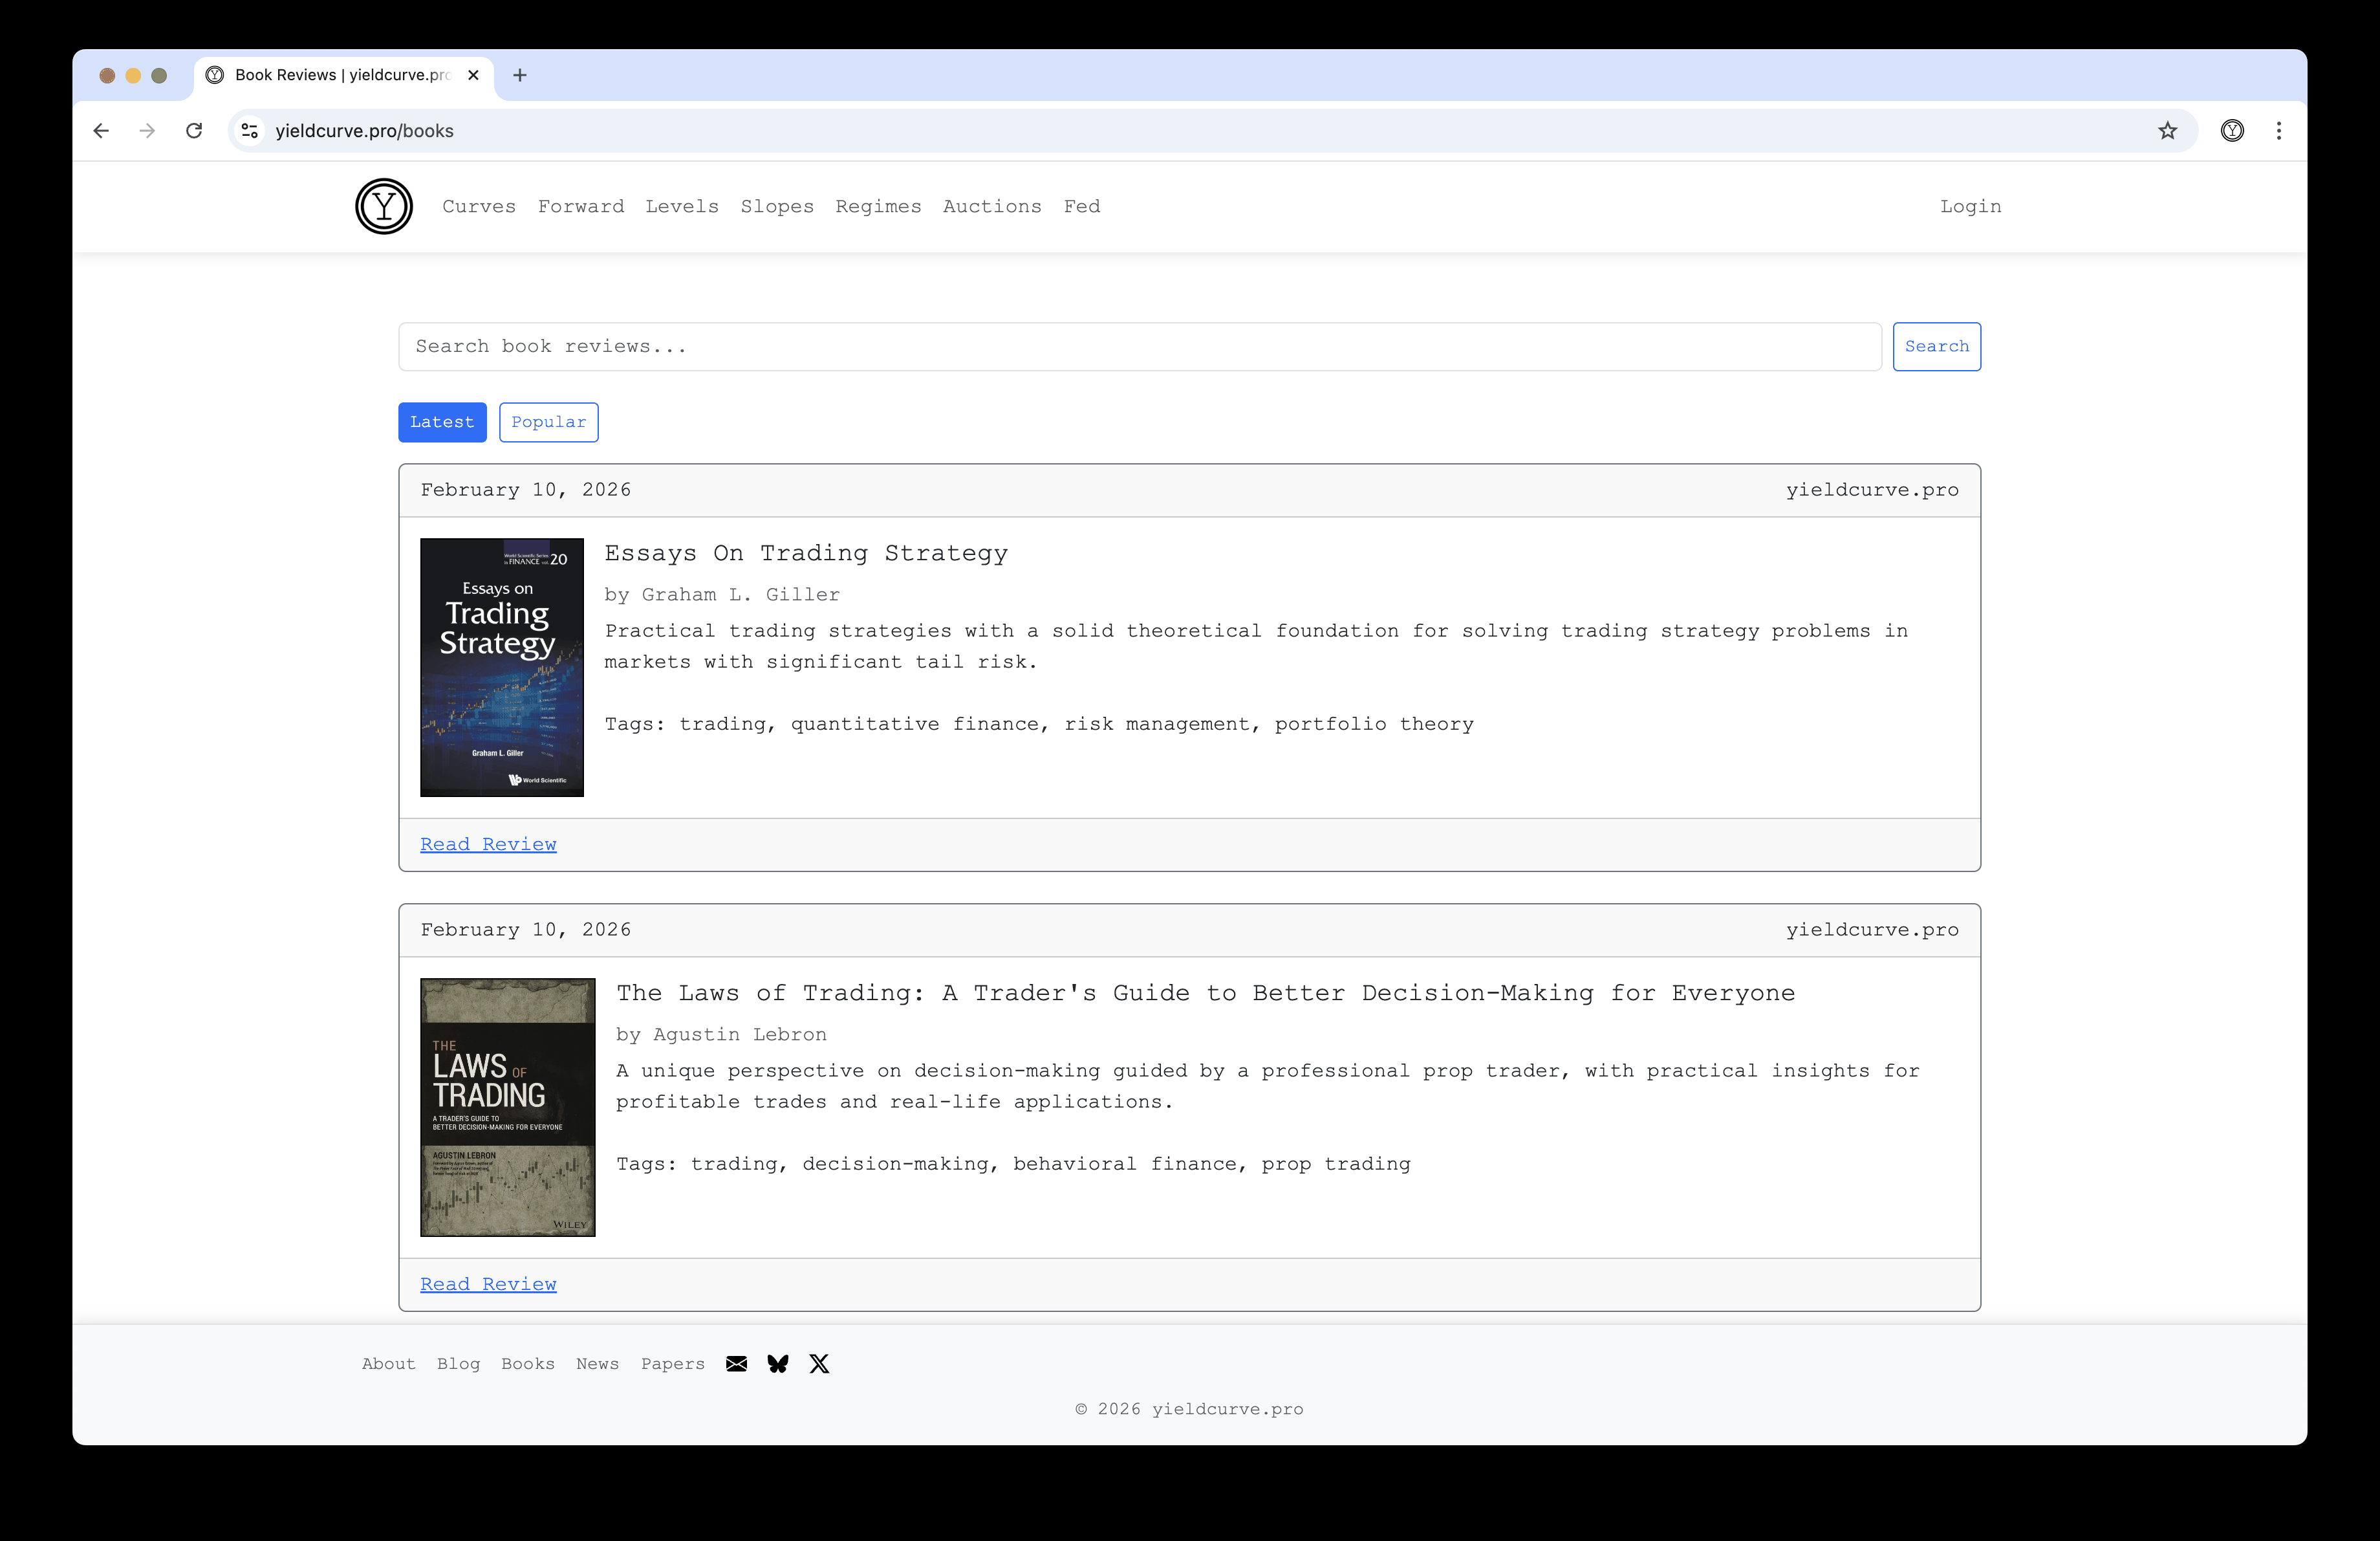
Instructions
- click on any book title to view it on Amazon
Notes
- this list reflects personal recommendations and is not exhaustive
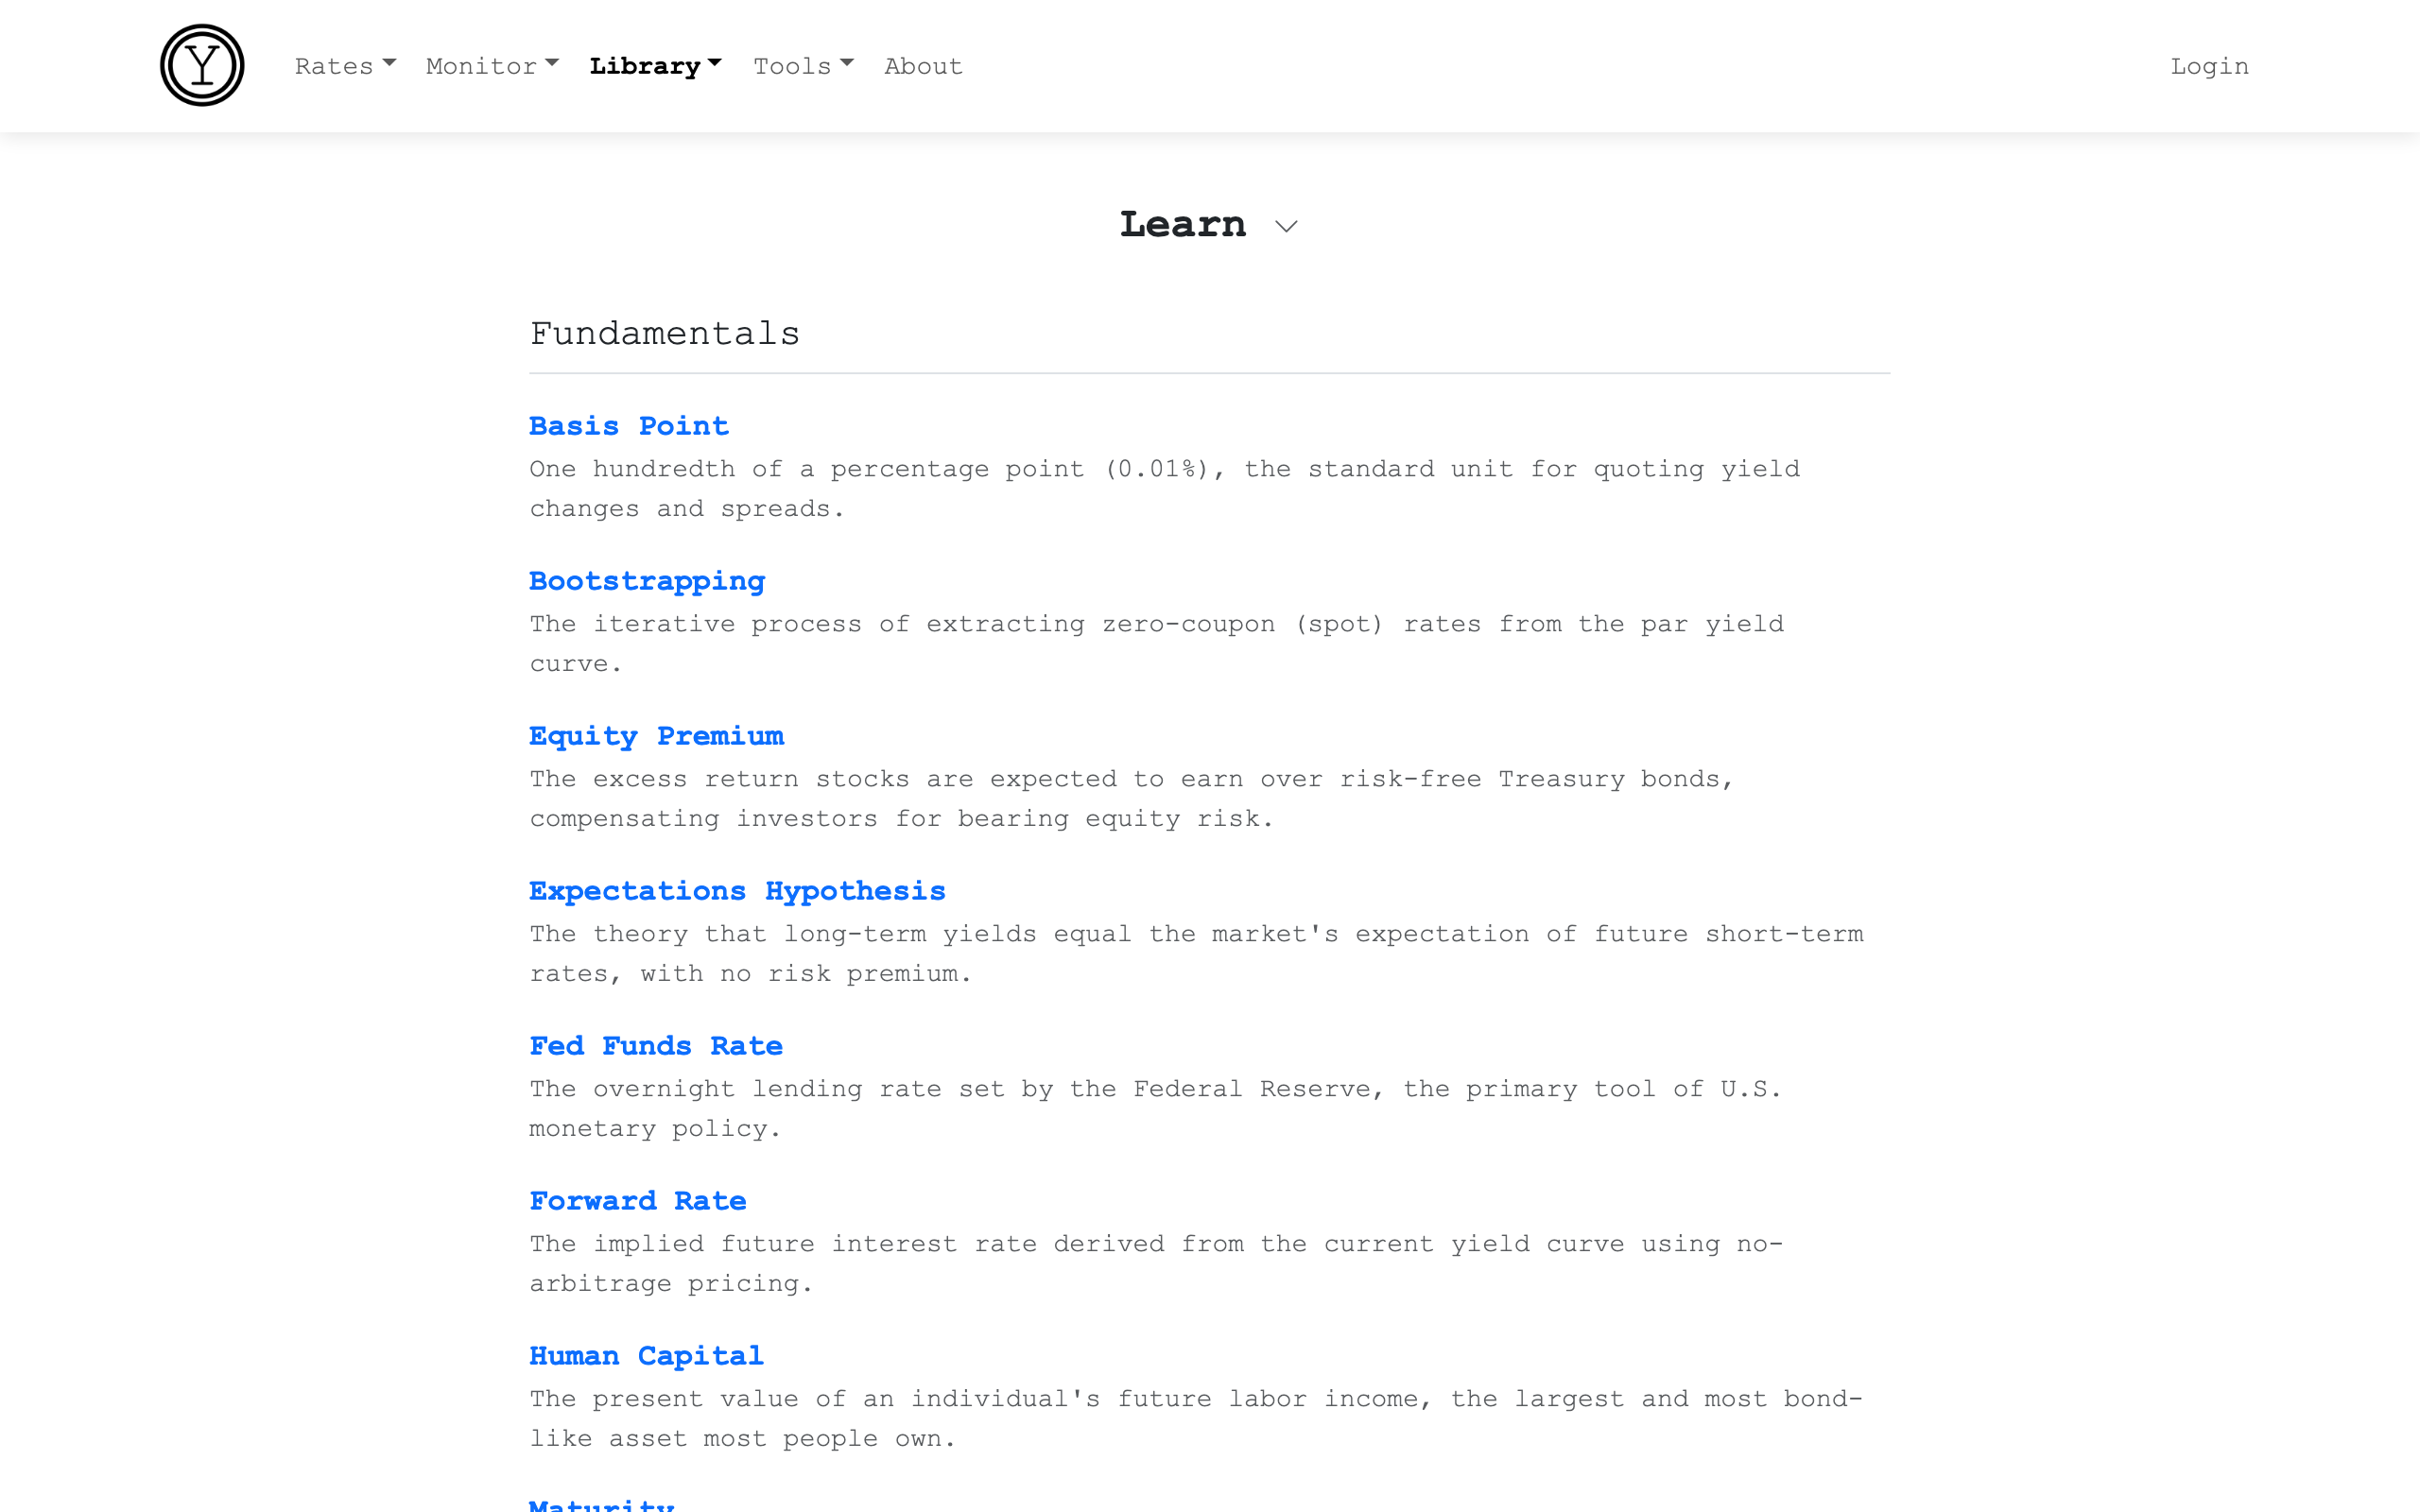
Learn
A yield curve glossary of fixed-income concepts, from fundamentals to trading strategies. Each entry explains a term used throughout the site's charting tools and analysis, with links to relevant charts and related concepts.
Instructions
- browse entries grouped by category
- click on any term to read the full explanation
- follow chart links to see the concept in live data
- explore related entries at the bottom of each page
Notes
- entries cover 7 categories: Fundamentals, Spreads & Slopes, Auctions, Risk Measures, Monetary Policy, Trading Strategies, and Models & Analytics
- each entry links to relevant charting tools and related glossary terms
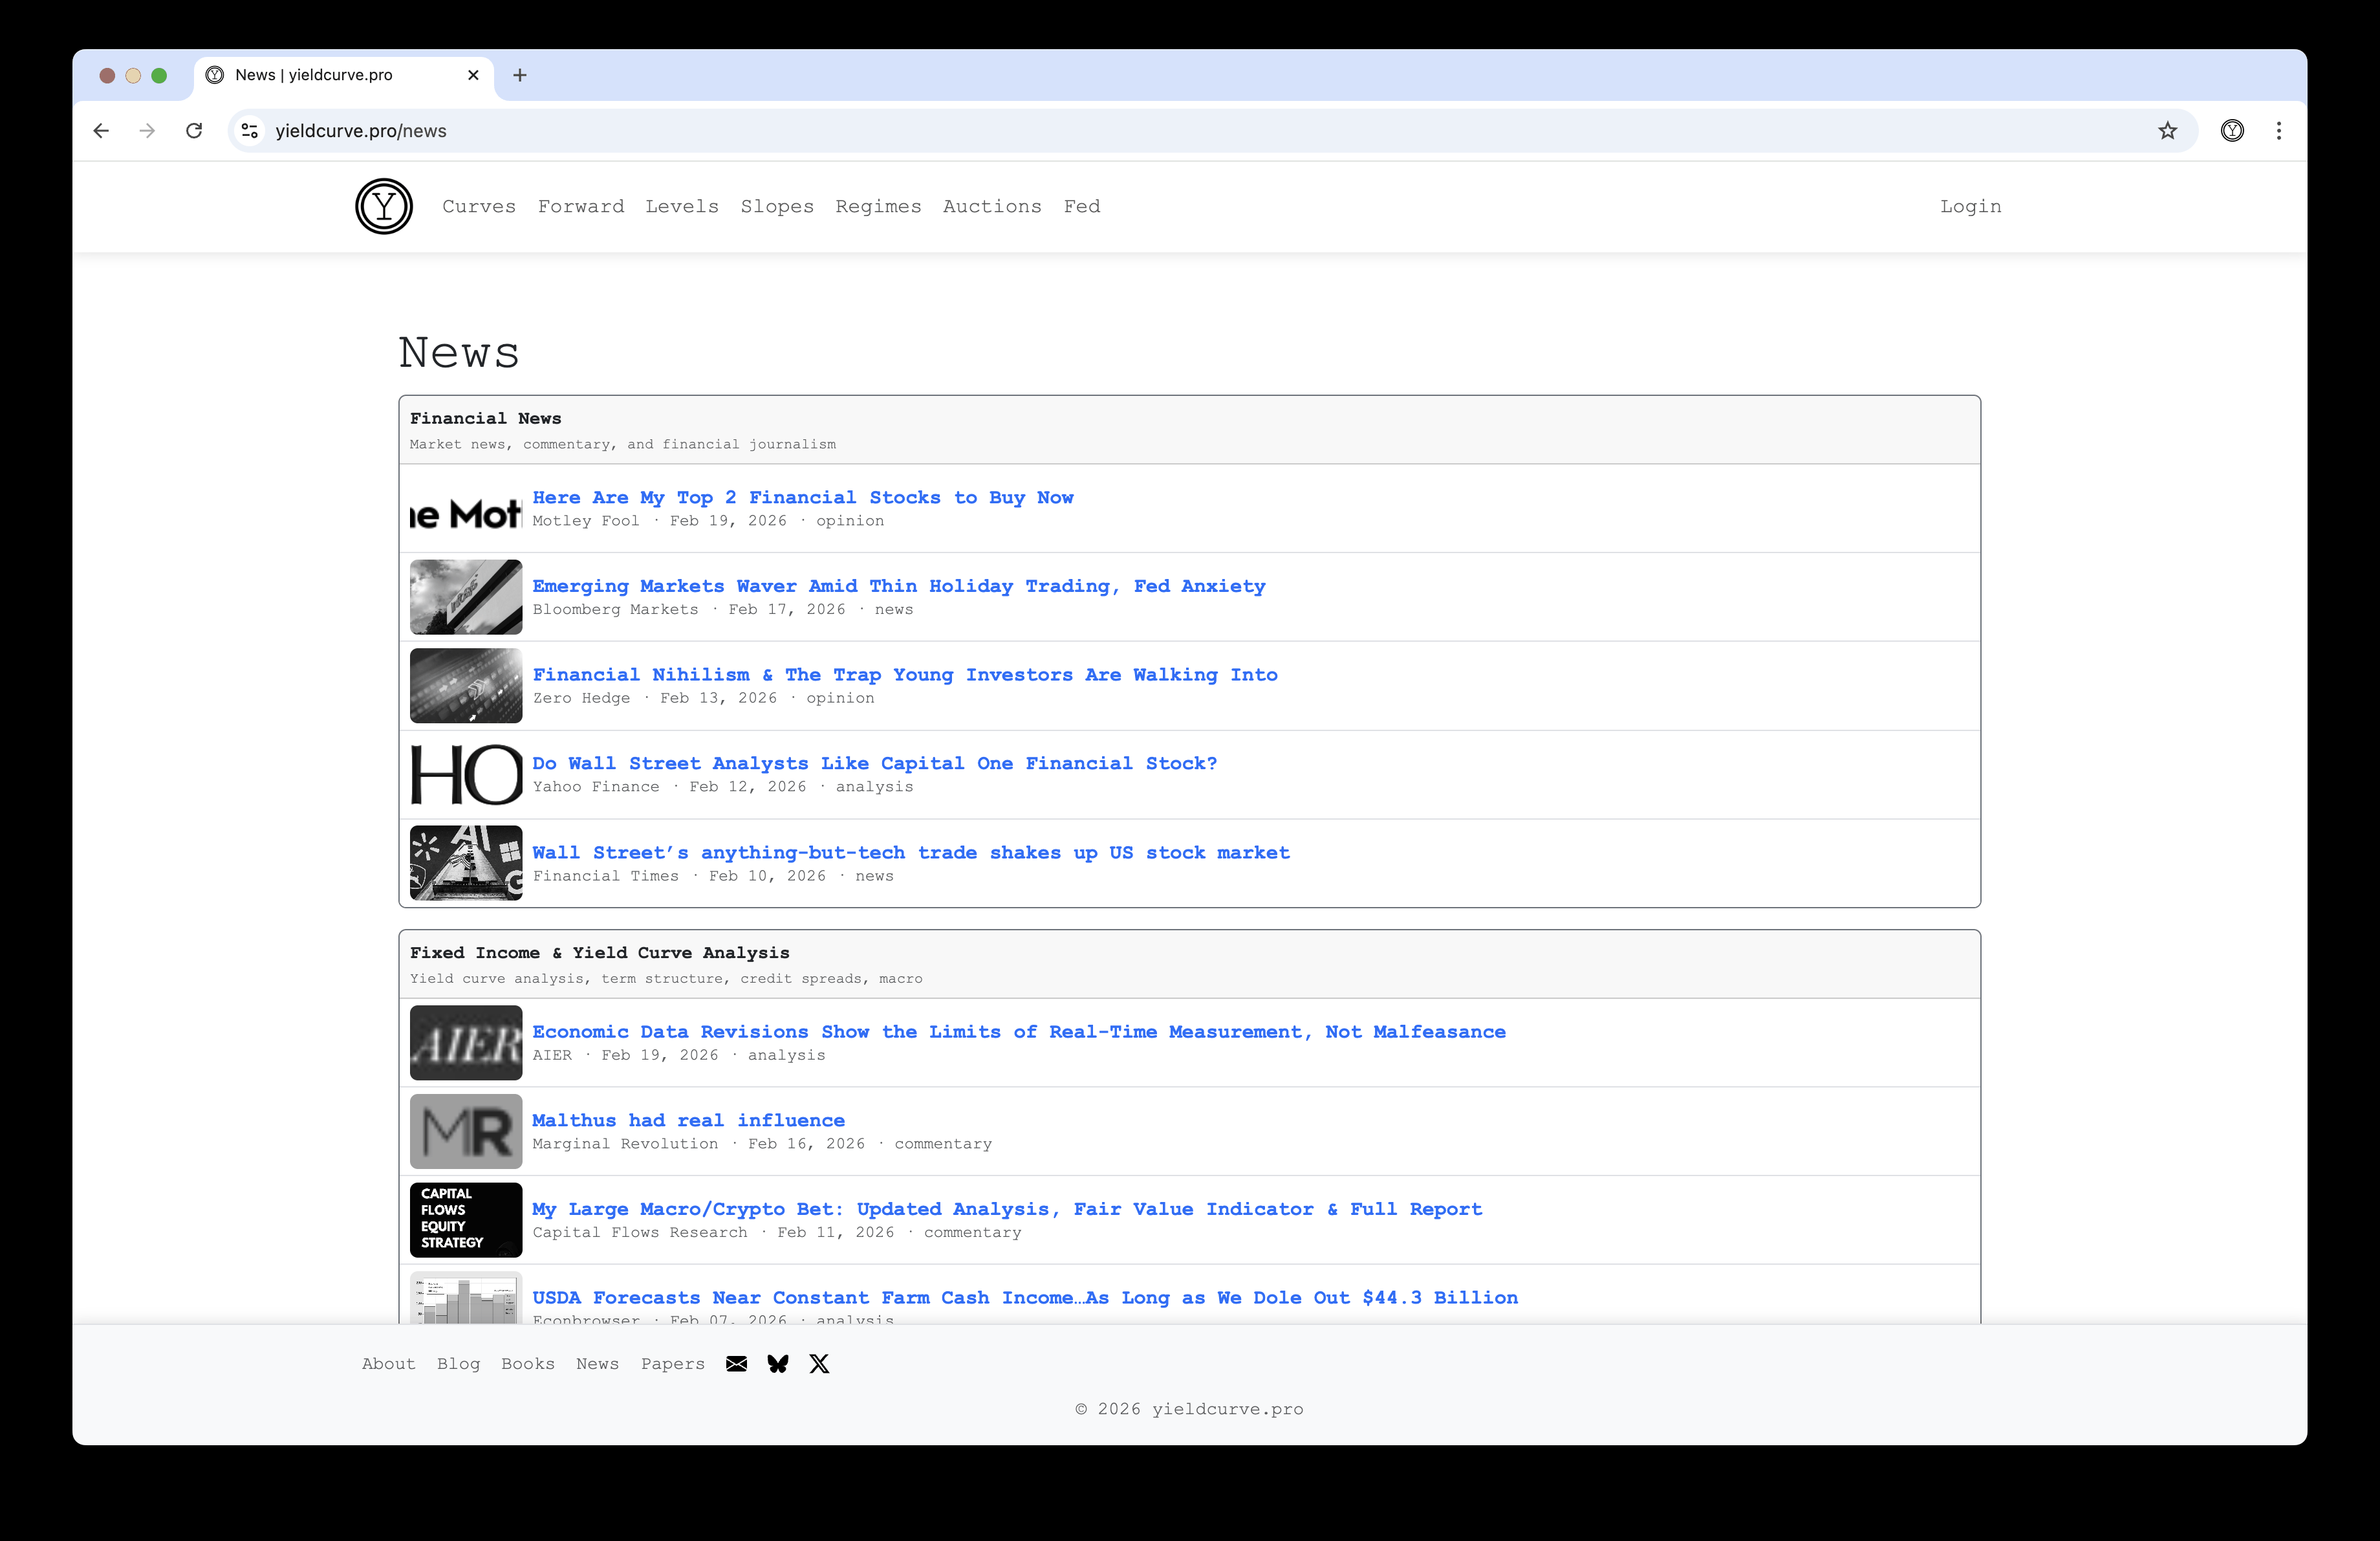
News
A curated feed of fixed-income and macroeconomic news from trusted RSS sources. Articles are scored for relevance to help surface the most important stories for yield curve and rates market participants.
Instructions
- browse articles organized by category (e.g., Fed & Monetary Policy, Treasury Markets)
- click on any headline to read the full article at its source
Notes
- articles are refreshed throughout the day from curated RSS feeds
- each article is scored for relevance to fixed-income topics
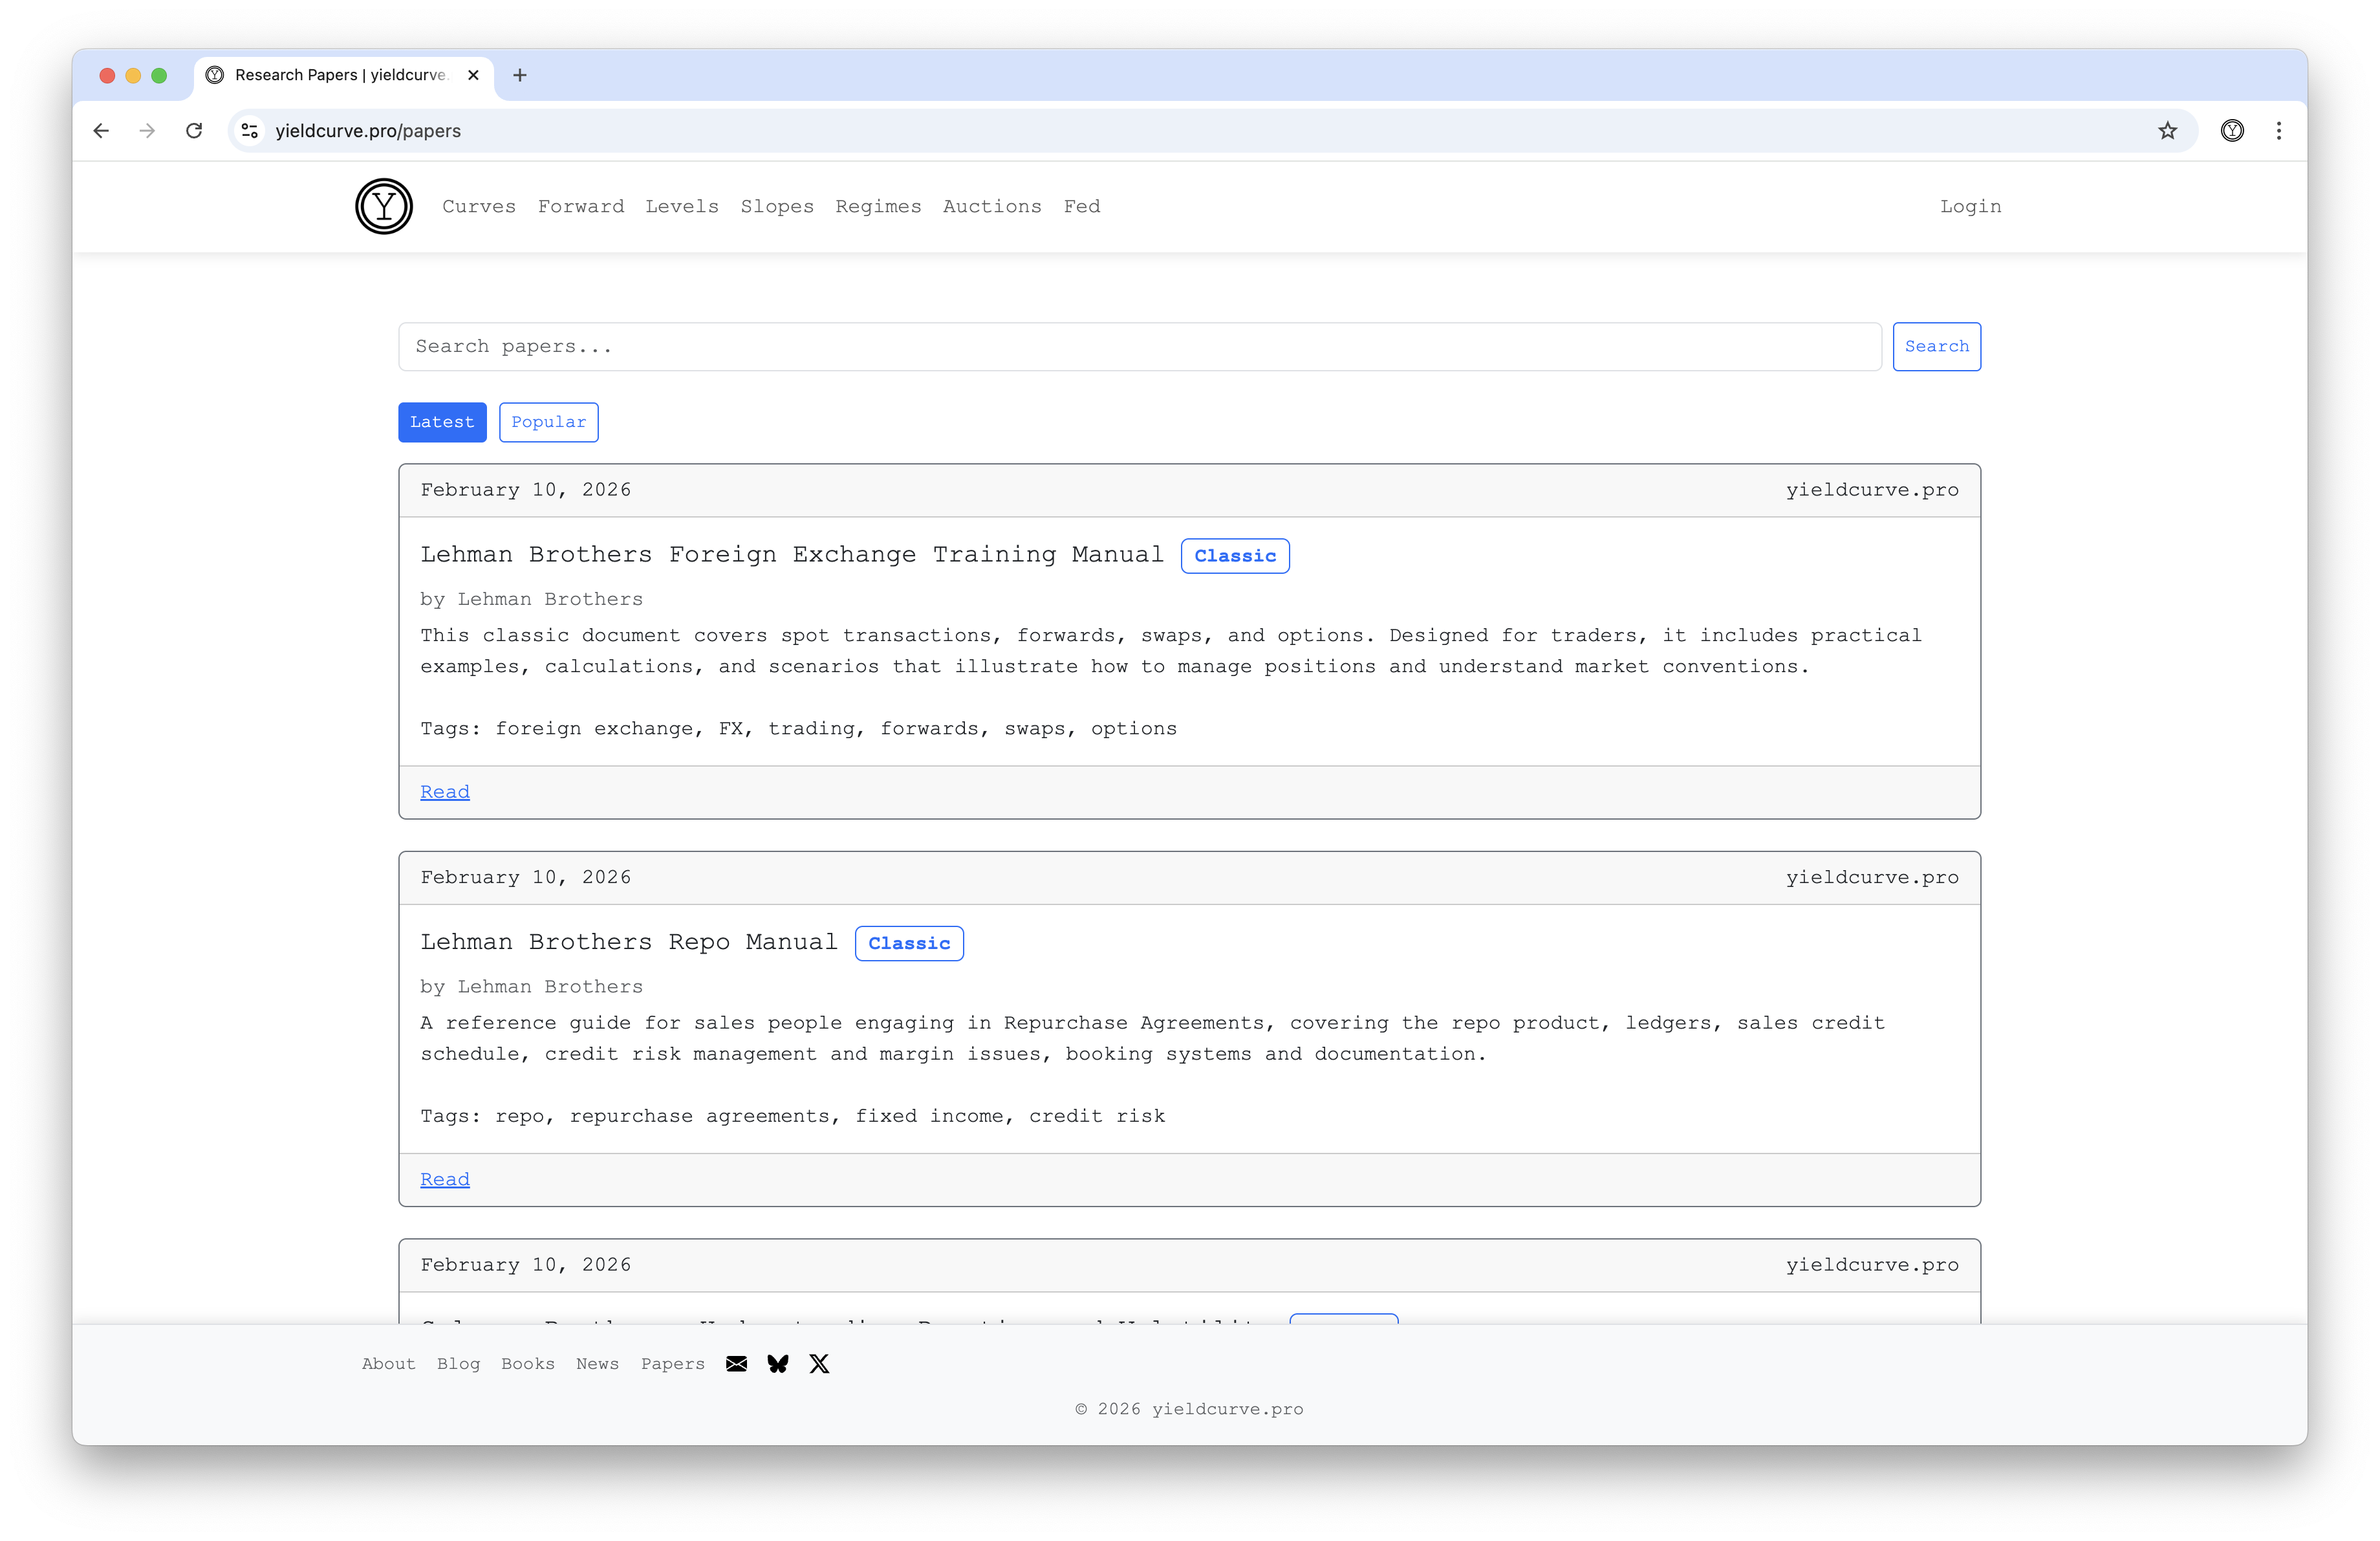
Papers
A collection of historically important and hard to find academic and industry research papers relevant to yield curve analysis, fixed-income, and the capital markets.
Instructions
- click on any paper title to access the PDF or source
- papers are organized by source
- click the sparkle button to discuss any paper with ChatYCP (login required)
Notes
- they are hosted...free of charge!
- try asking ChatYCP: "What are the main findings of this paper?" or "How does this relate to term premium estimation?"
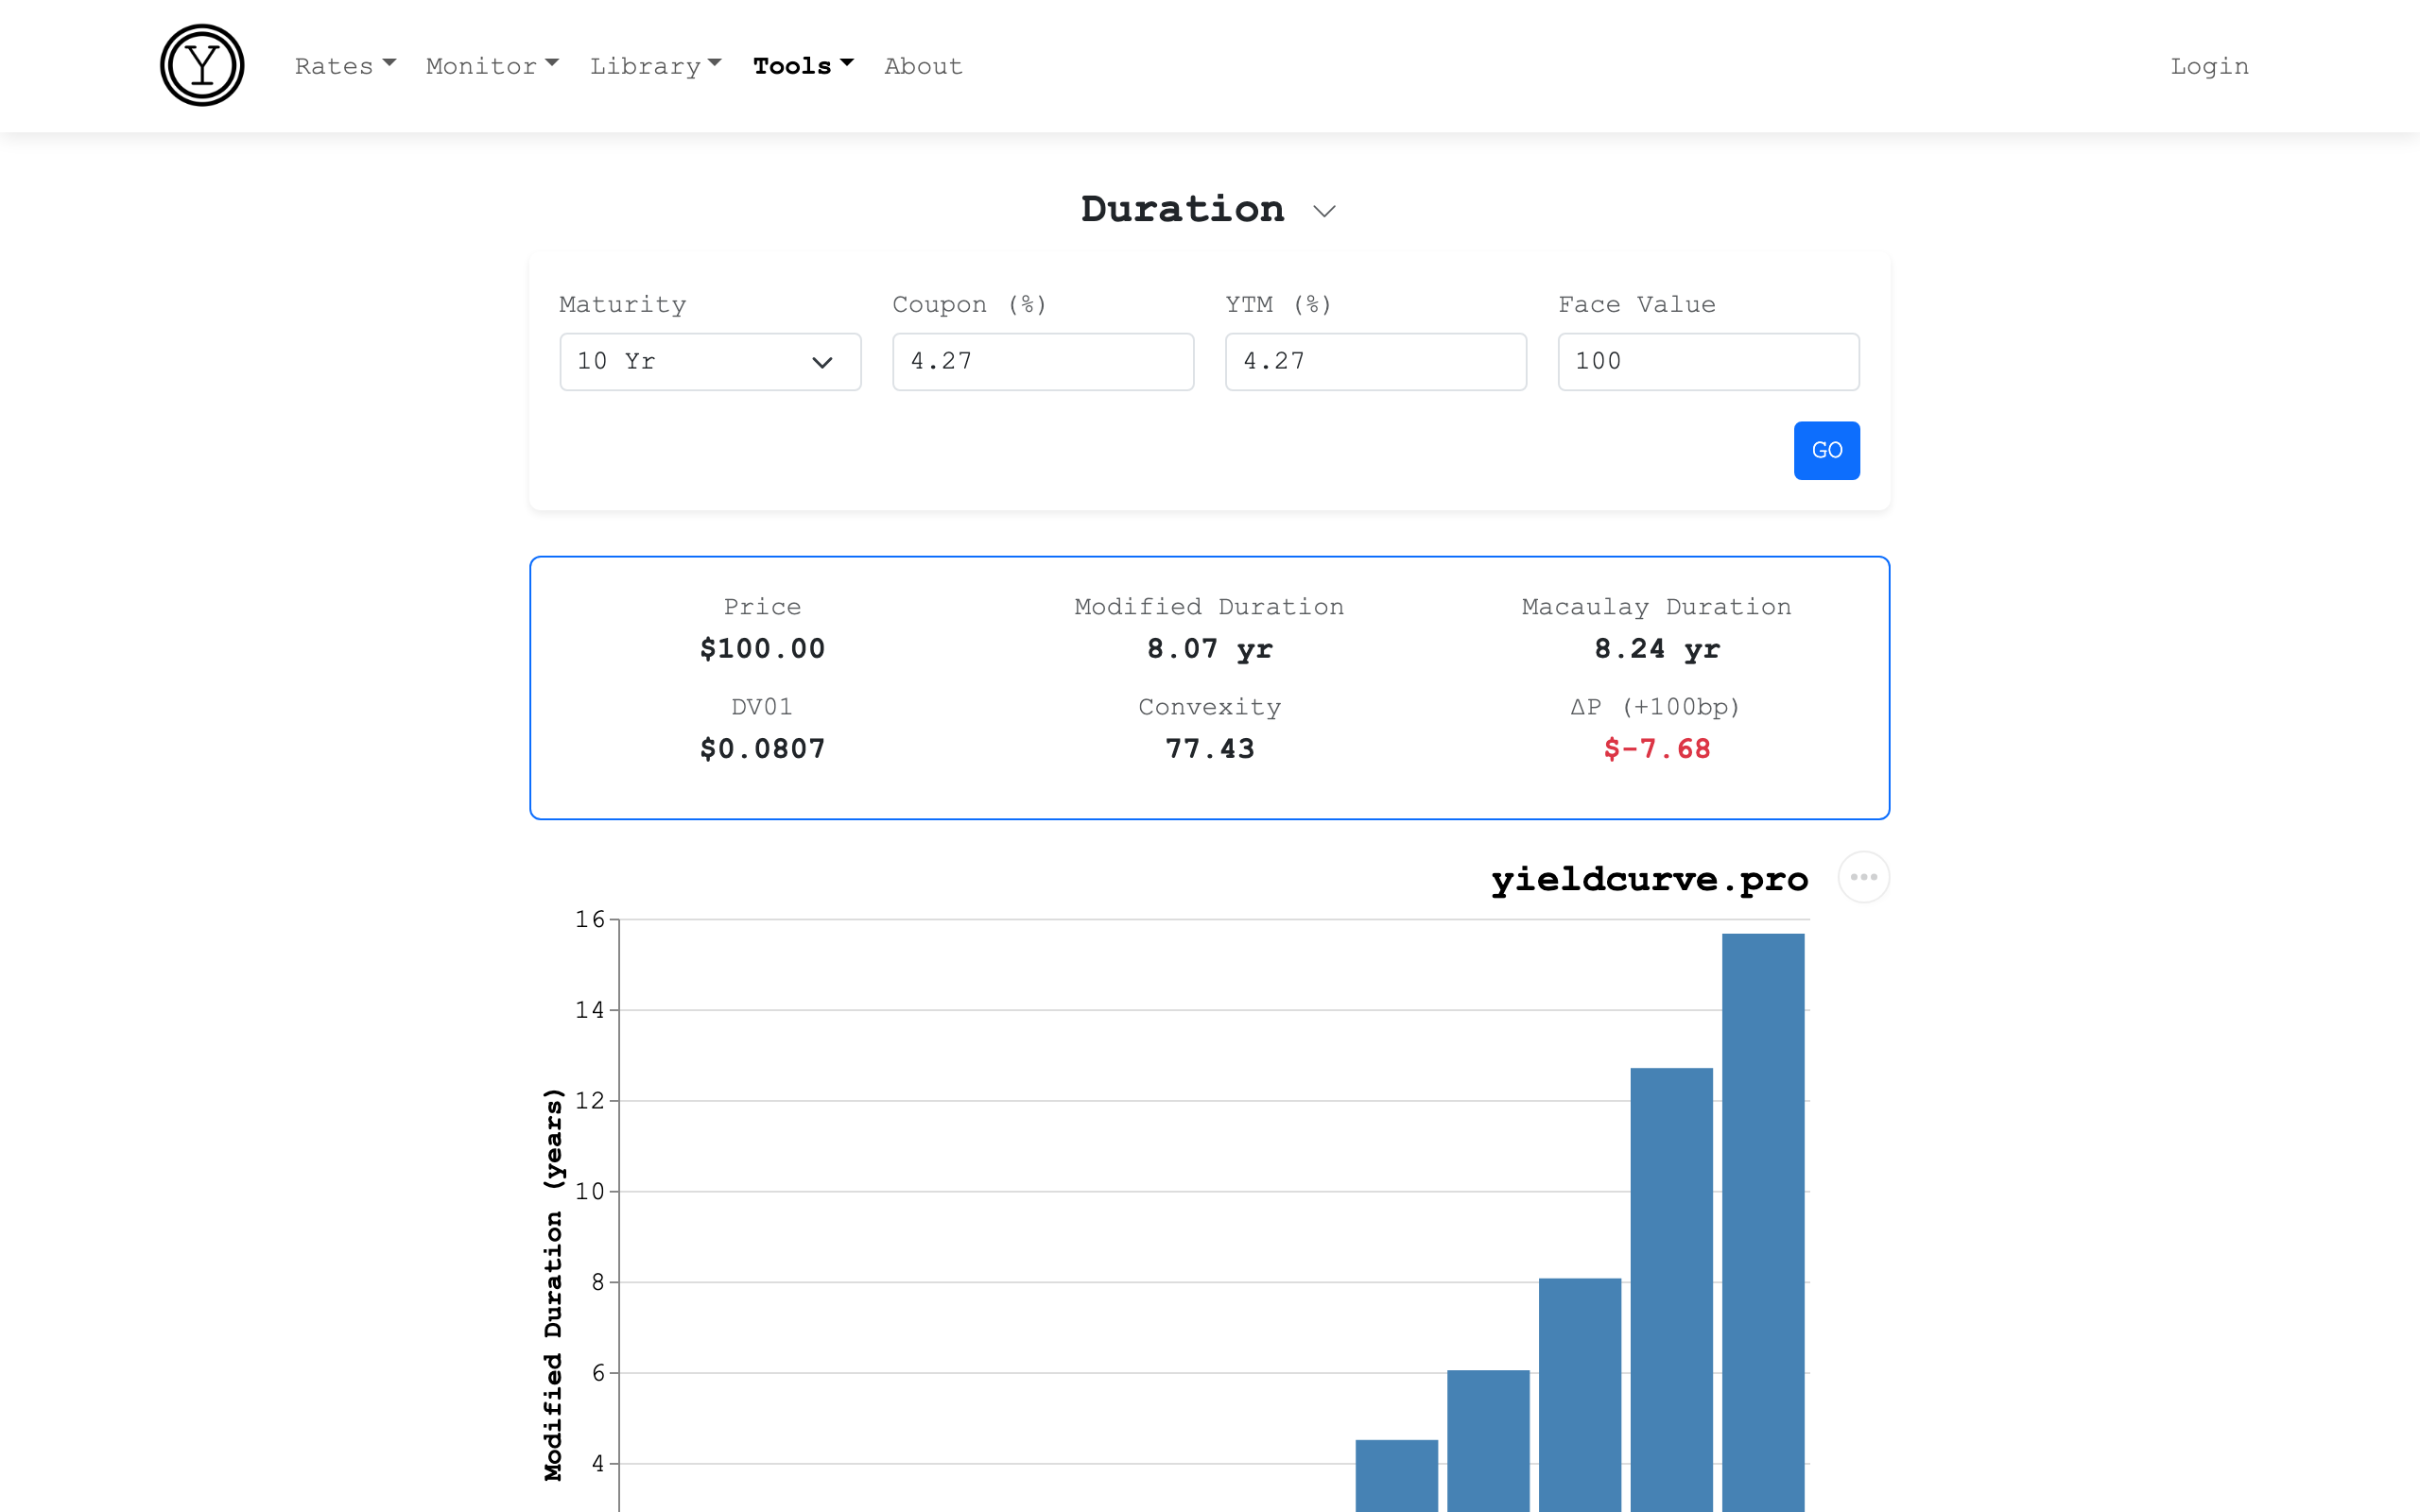
Duration
Compute the key risk metrics for any US Treasury bond: modified duration, Macaulay duration, DV01 (dollar value of a basis point), and convexity. All calculations use semiannual compounding per US Treasury convention.
Instructions
- select a Maturity from the dropdown (1 Mo through 30 Yr)
- enter a Coupon rate and YTM (yield to maturity) as percentages — defaults are the current par yields
- optionally change the Face Value (default $100)
- click GO to compute all metrics
Results
- Price — the clean price given the coupon rate and YTM
- Modified Duration — the percentage price change per 1% yield change; the primary interest rate risk measure
- Macaulay Duration — the weighted-average time to receive all cash flows, in years
- DV01 — the dollar price change for a 1 basis point move in yield
- Convexity — the second-order curvature of the price-yield relationship; higher convexity benefits the bondholder in both directions
- ΔP (+100bp) — estimated dollar price change for a 100bp rate increase using the duration + convexity approximation
The chart shows the modified duration profile across all standard US Treasury maturities at current par yields.
Use Cases
- quickly estimate how much a bond's price will move for a given rate change
- compare DV01 across maturities for hedge ratio construction
- understand why longer-maturity bonds have more interest rate risk
- verify duration and convexity values from Bloomberg or other systems
Formulas
For a bond with semiannual coupons, where $t$ indexes semiannual periods, $PV(CF_t)$ is the present value of each cash flow discounted at $y/2$, $P$ is the bond price, and $y$ is the yield to maturity as a decimal:
Macaulay Duration
$$D_{mac} = \frac{\sum_t t \cdot PV(CF_t)}{P}$$
$t$ is in semiannual periods; divide by 2 to convert to years.
Modified Duration
$$D_{mod} = \frac{D_{mac}}{1 + y/2}$$
DV01
$$DV01 = \frac{D_{mod} \cdot P}{10{,}000}$$
Convexity
$$C = \frac{\sum_t t(t+1) \cdot PV(CF_t)}{P \cdot (1 + y)^2}$$
Divide by 4 to convert from semiannual to annual units.
Price Approximation
$$\Delta P \approx -D_{mod} \cdot \Delta y \cdot P + \frac{1}{2} \cdot C \cdot (\Delta y)^2 \cdot P$$
Per-tenor pages (e.g. /duration/10-year) show live metrics at
current par yields for each standard Treasury maturity.
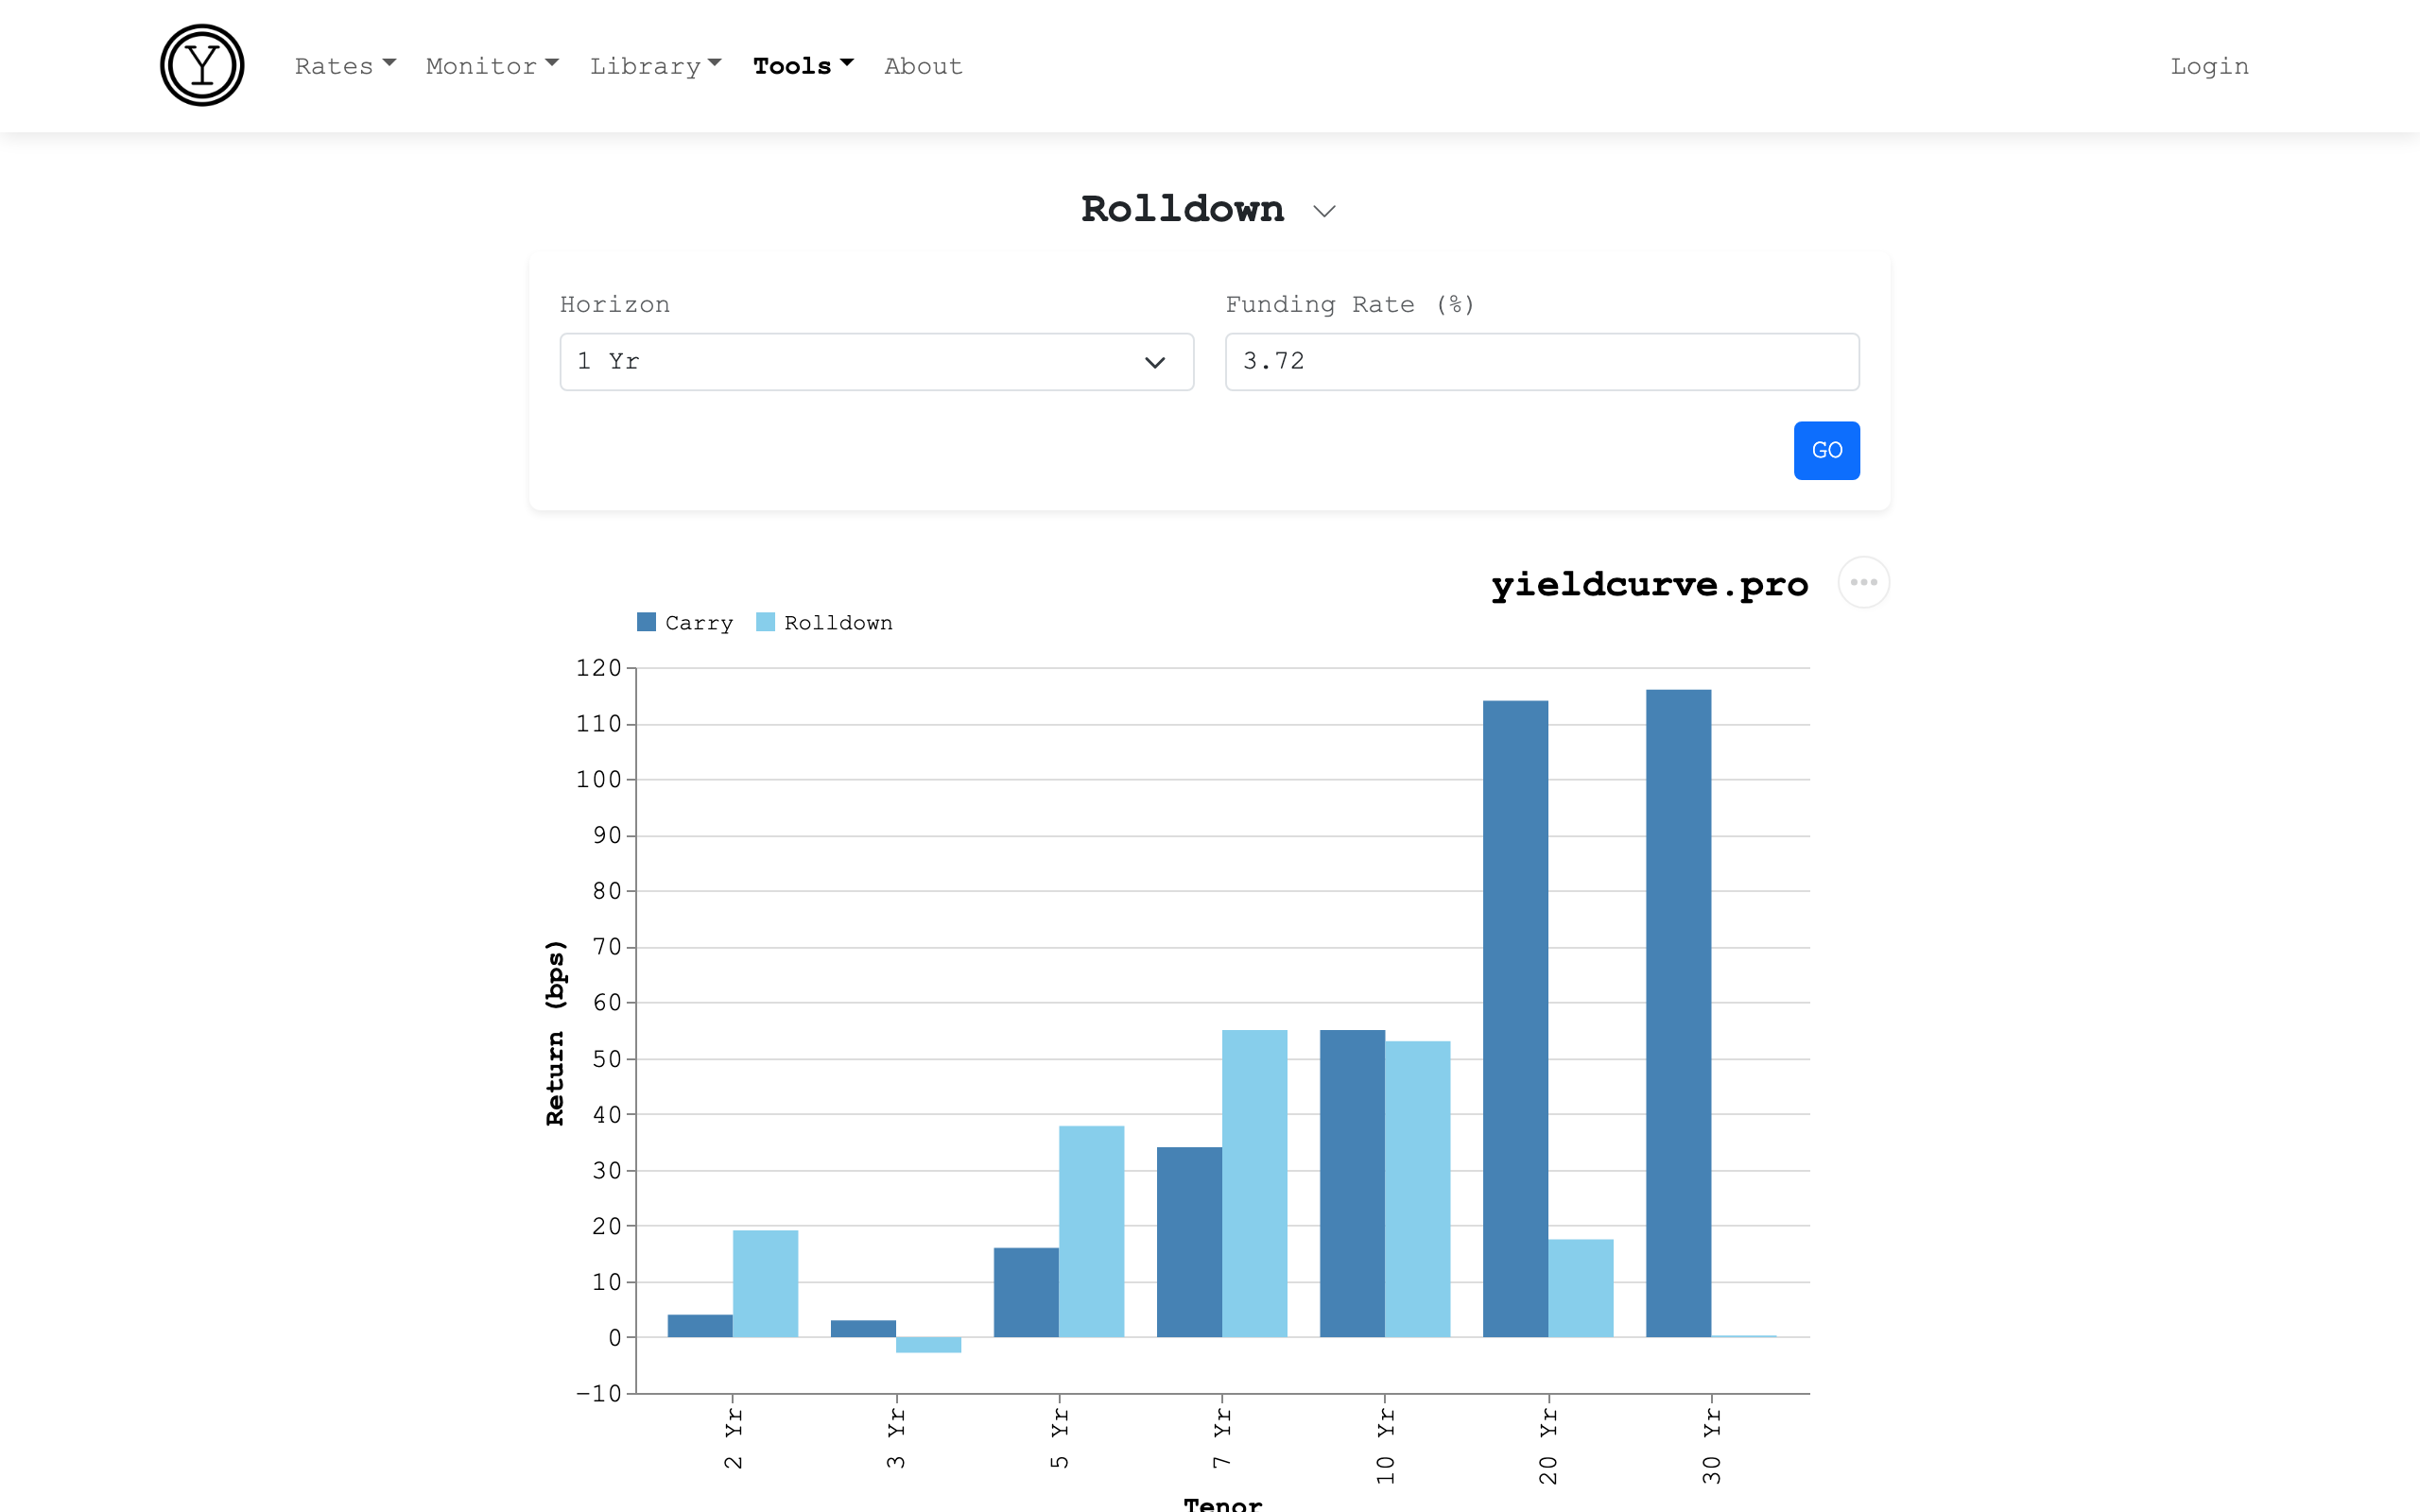
Rolldown & Carry
Estimate the expected return from holding a Treasury bond over a specified horizon, broken into two components: carry (income over funding cost) and rolldown (price appreciation from sliding down the yield curve).
Instructions
- select a Horizon — 3 Mo, 6 Mo, or 1 Yr holding period
- enter a Funding Rate — defaults to the current 3 Mo Treasury yield
- click GO to compute returns for all tenors
Results
- Yield — current par yield for each tenor
- Carry (bps) — income earned above the funding rate over the holding period: (yield − funding rate) × horizon
- Rolldown (bps) — price appreciation from the bond "rolling down" to a shorter maturity on an unchanged curve, estimated via modified duration × yield change (PCHIP-interpolated)
- Total (bps) — carry + rolldown (the expected total return if the curve does not change)
The chart shows carry (blue) and rolldown (lighter blue) as stacked bars for each tenor, making it easy to identify the sweet spot — the maturity offering the best risk-adjusted total return.
Use Cases
- identify the tenor with the highest carry + rolldown ("sweet spot" trade)
- compare the carry cost of being short the front end vs. the rolldown benefit of owning the belly
- evaluate whether the yield curve offers enough rolldown to justify extending duration
- understand how inverted curves flip the carry and rolldown dynamics
Notes
- carry is simple: yield minus funding rate, scaled by horizon
- rolldown assumes the yield curve shape does not change over the holding period
- rolldown uses PCHIP interpolation to estimate the yield at the post-horizon maturity
- negative total return on some tenors is normal when the curve is inverted
- carry and rolldown figures are totals over the selected holding period, not annualized rates
Per-tenor/horizon pages (e.g. /rolldown/10-year/1-year) show the
carry and rolldown breakdown for a specific maturity and holding
period at current yields.
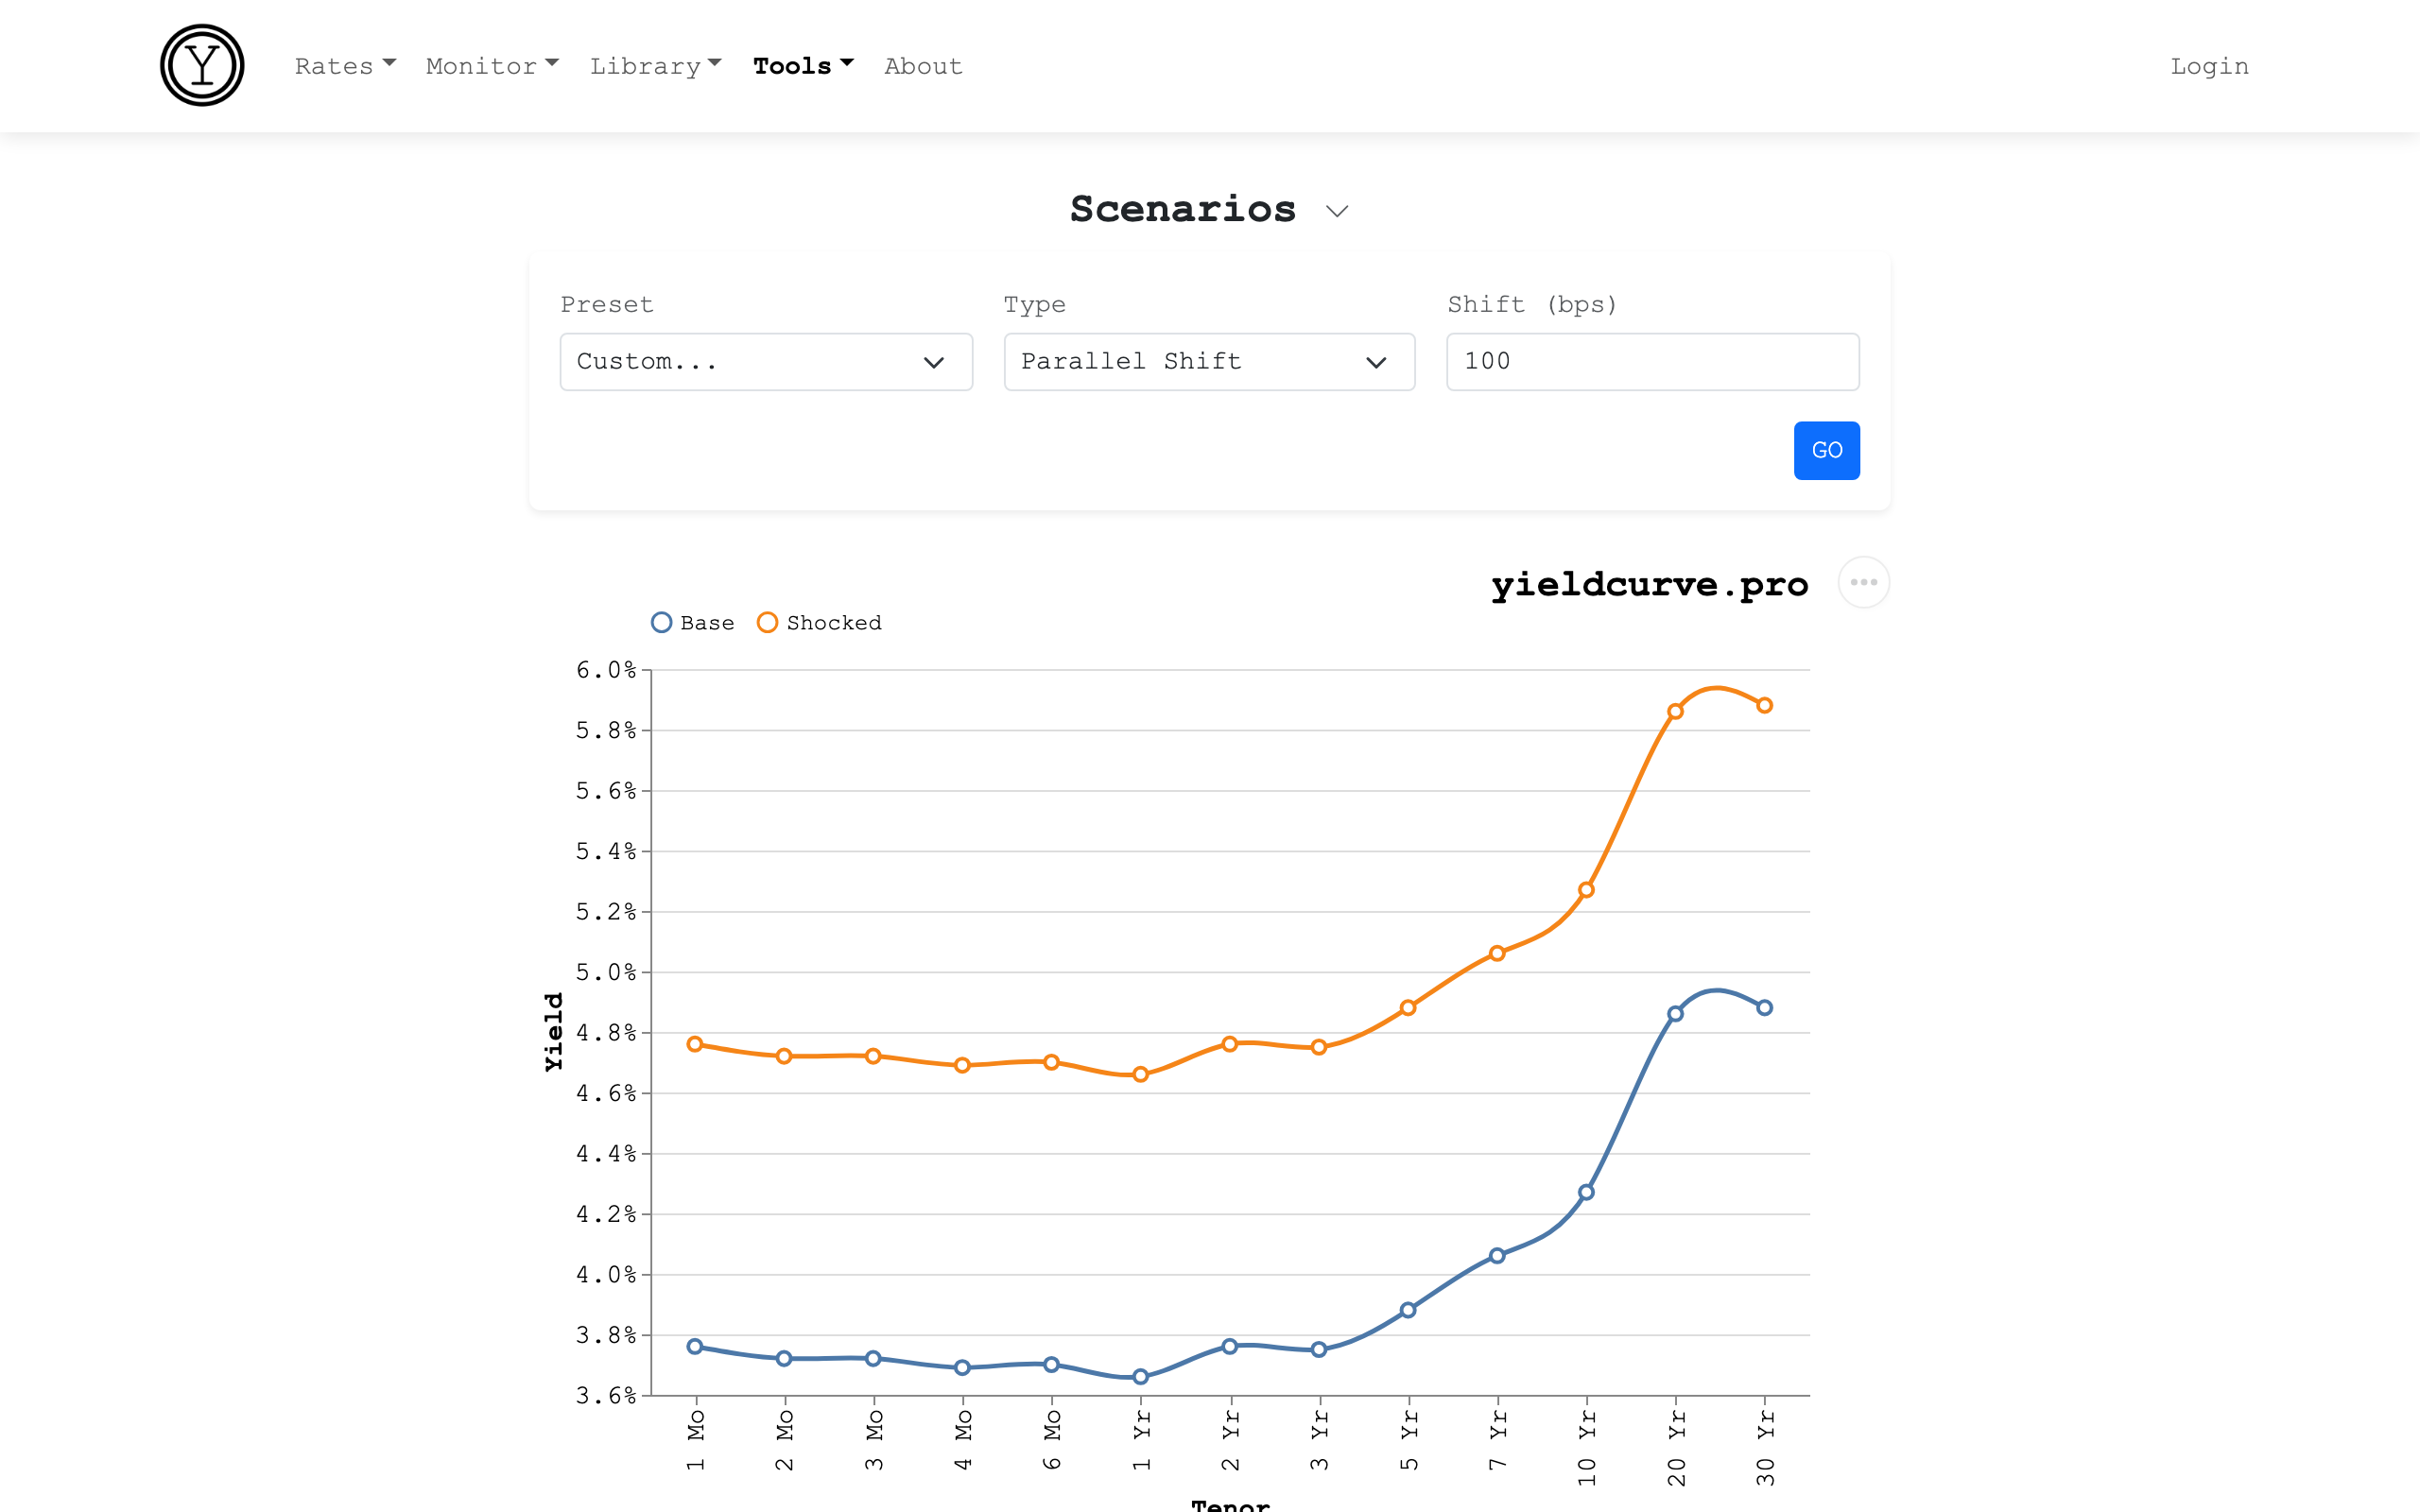
Scenarios
Apply parallel shifts, twist scenarios, or custom shocks to the current US Treasury yield curve and see the price impact and income offset across all maturities. The simulator uses the duration + convexity approximation for accurate estimates even for large moves.
Instructions
- select a Preset from the dropdown for a common scenario (Fed Hikes, Recession, Bear Flattener, etc.)
- or select a Type — Parallel Shift or Twist
- for parallel: enter the Shift in basis points (positive = rates up)
- for twist: enter separate Short End and Long End shifts
- intermediate tenors are linearly interpolated
- click GO to compute the impact
Results
- Chart — the base yield curve overlaid with the shocked curve (both solid lines)
- Impact table — per-tenor breakdown (columns on the main
/scenariospage; per-preset pages show a condensed set without Dur/DV01)- Base (%) — yield before the shock
- ΔY (bps) — yield change applied by the shock
- Post (%) — yield after the shock
- Dur and DV01 ($) — rate sensitivity at the base yield level (main page only)
- ΔP ($) — estimated dollar price change per $100 face, using duration + convexity
- Income ($) — annual coupon income per $100 face at the pre-shock yield
- Net ($) — coupon income plus price change per $100 face, positive when income covers the loss within one year
Preset Scenarios
- Fed Hikes +100bp — parallel shift up (aggressive tightening)
- Fed Cuts -100bp — parallel shift down (easing cycle)
- Recession — front end -150bp, long end -50bp (bull steepener)
- Bear Flattener — short rates +150bp, long rates +50bp (policy tightening)
- Bull Steepener — short rates -100bp, long end unchanged (rate cuts begin)
- Bear Steepener — long rates +100bp, short end unchanged (term premium repricing)
- Bull Flattener — long rates -75bp, short end -25bp (flight to quality)
- Stagflation — parallel +200bp (persistent inflation)
Use Cases
- stress-test a portfolio against standard rate scenarios
- visualize how different parts of the curve respond to specific shocks
- compare the price sensitivity of short vs. long bonds under various macro regimes
- build intuition for duration and convexity effects at different yield levels
- identify which tenors earn enough income to offset the price loss within one year
- compare income offset across twist scenarios — a bear steepener leaves short-end tenors positive while hammering the long end
Per-scenario pages (e.g. /scenarios/recession) show the current
curve under a specific preset shock.
Alerts
Set email notifications for when yields, slopes, or levels cross your thresholds. Alerts fire once and consume one credit when triggered.
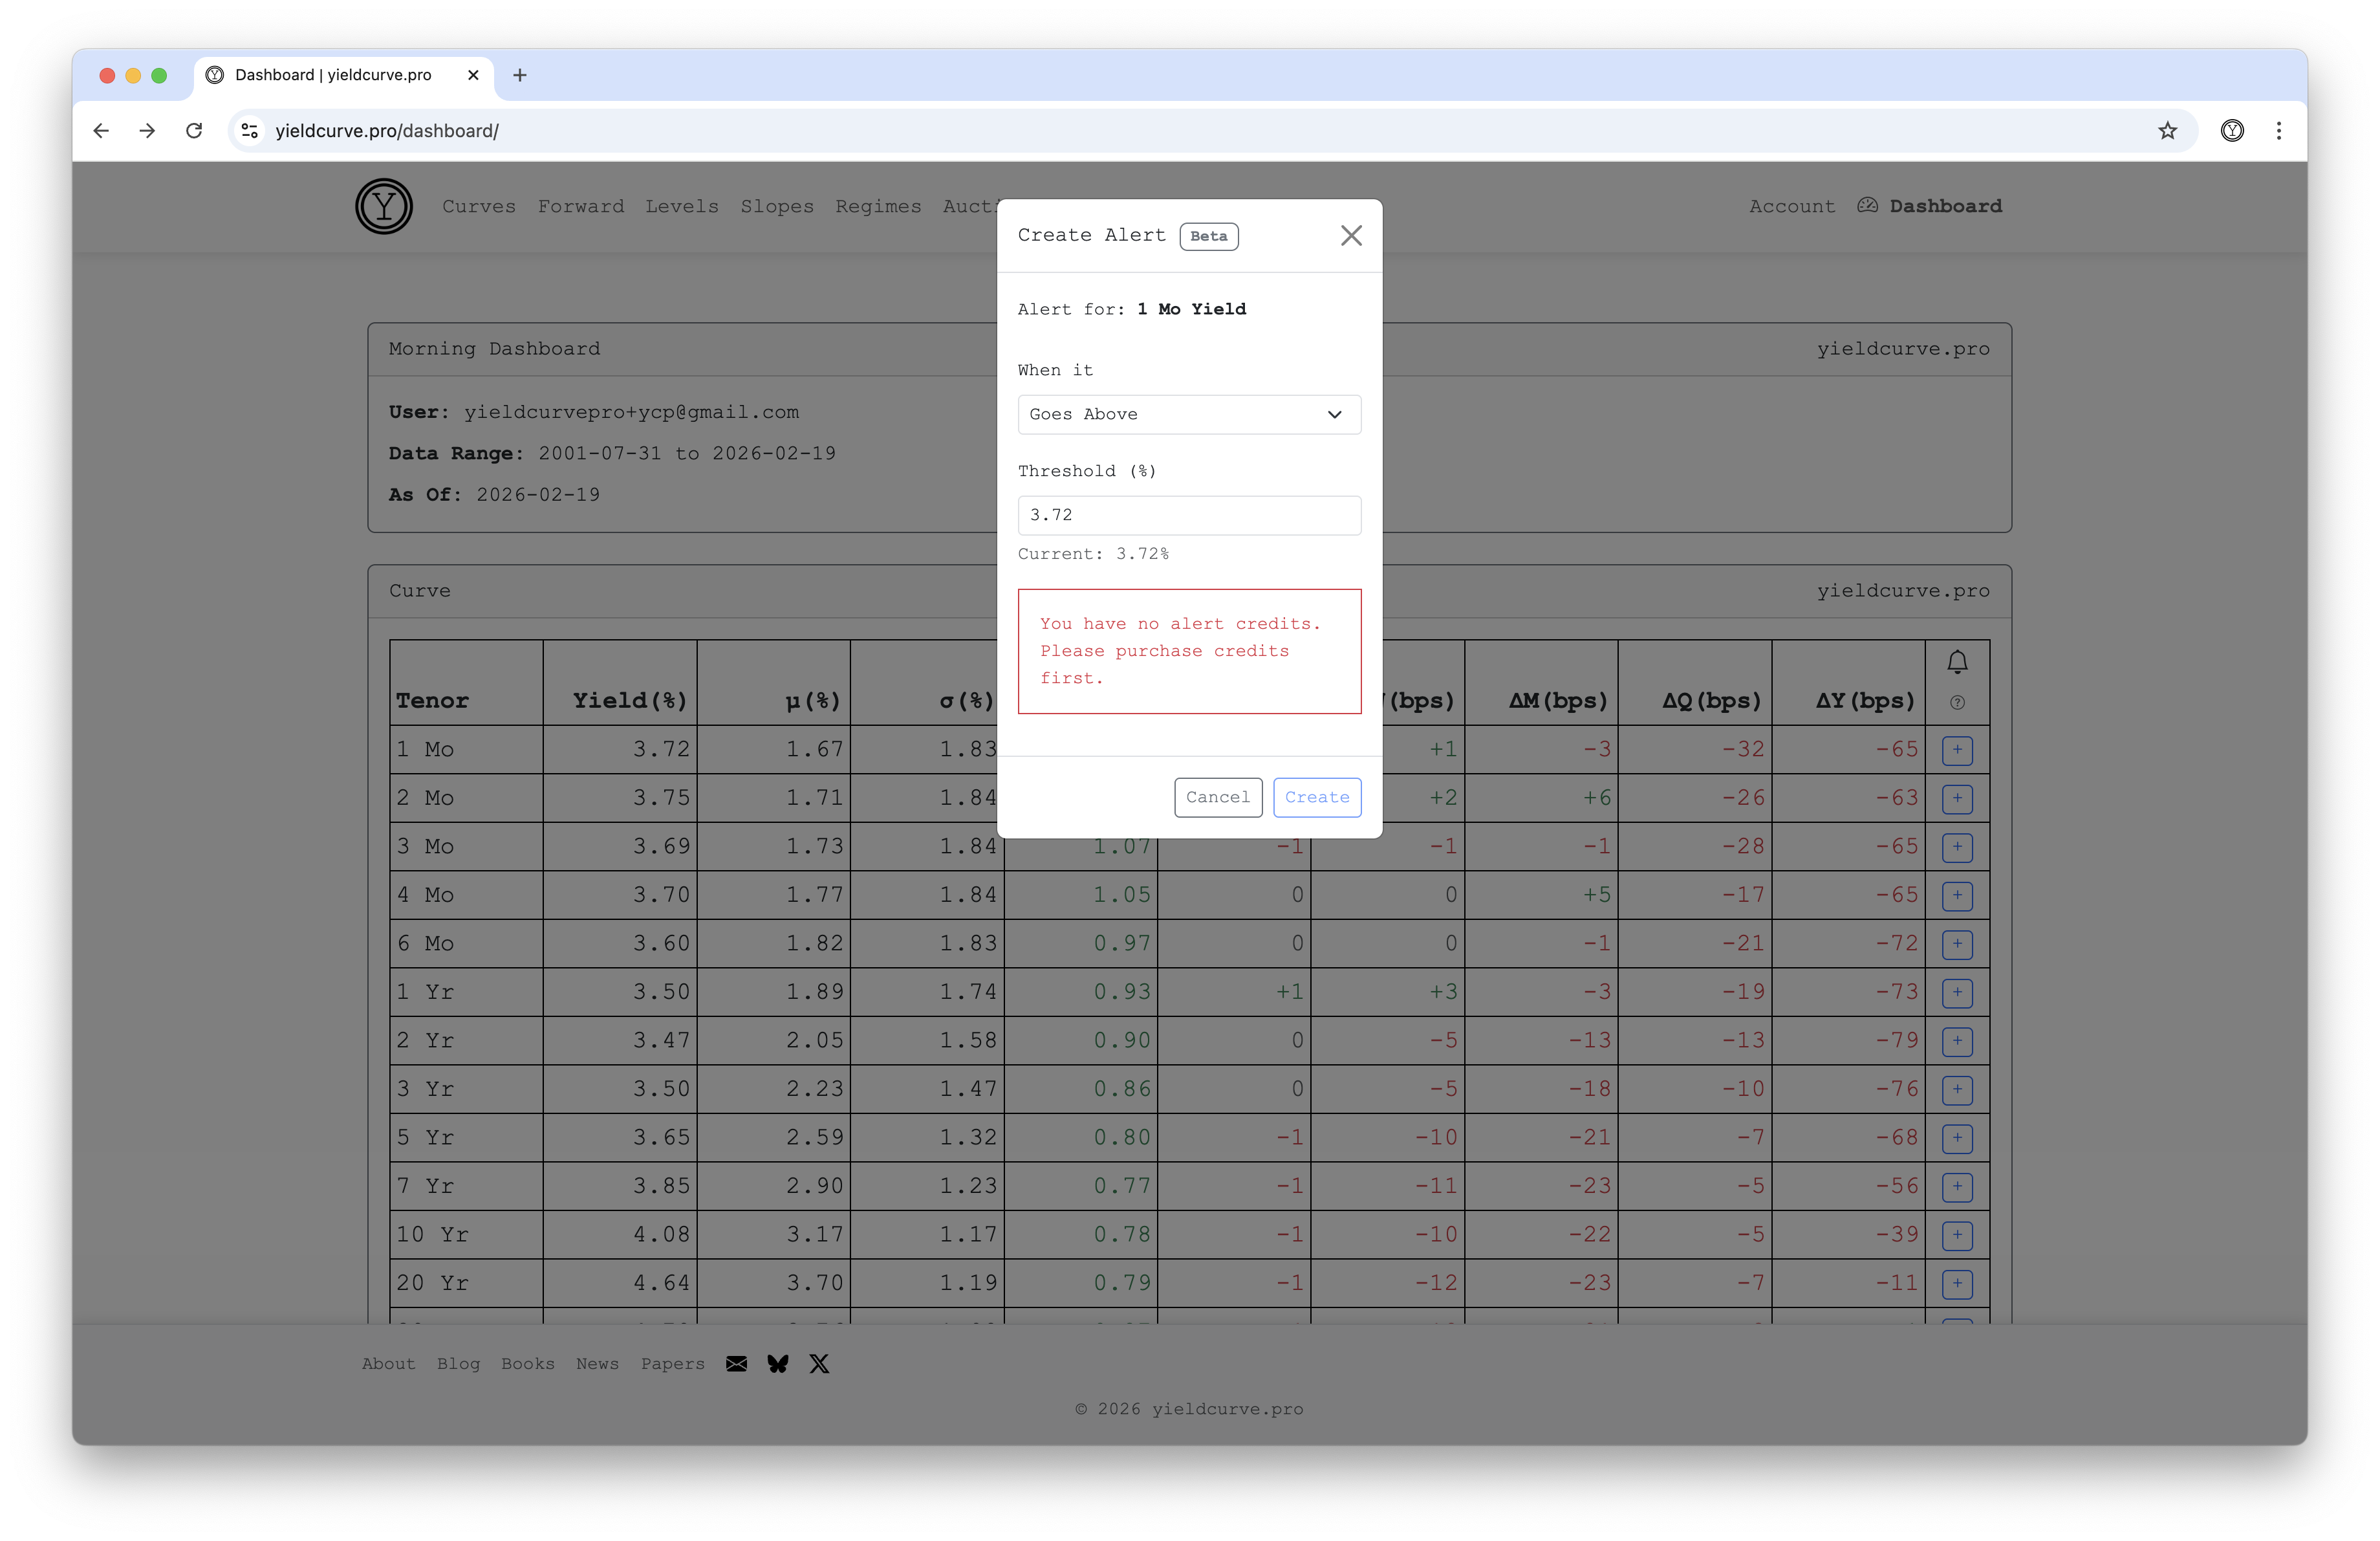
Alert Types
- Curve — notifies when a specific tenor's yield crosses above or below your threshold (e.g., "10 Yr yield above 4.50%")
- Level — notifies when the overall yield level crosses your threshold
- Slope — notifies when the yield curve slope (long minus short tenor) crosses your threshold (e.g., "10Y-3Mo spread below 0%")
How to Create Alerts
- use the + button next to any row in the Curve or Level & Slope tables
- select the direction (above / below) and enter a threshold
- alerts are evaluated daily after Treasury data is published
Notes
- one credit is consumed each time an alert fires
- triggered alerts are automatically deleted (one-shot)
- purchase credits via Buy Credits in your account
- manage existing alerts via My Alerts in your account
Use Cases
- get notified when yields reach attractive entry points
- monitor yield curve inversions or steepening
- set price alerts for specific Treasury tenors
API
Programmatic access to US Treasury yield curve data, auction results, term premia, and FOMC decisions via a REST API with JSON responses. The built-in playground lets you try any endpoint immediately in sandbox mode — no account or API key required.
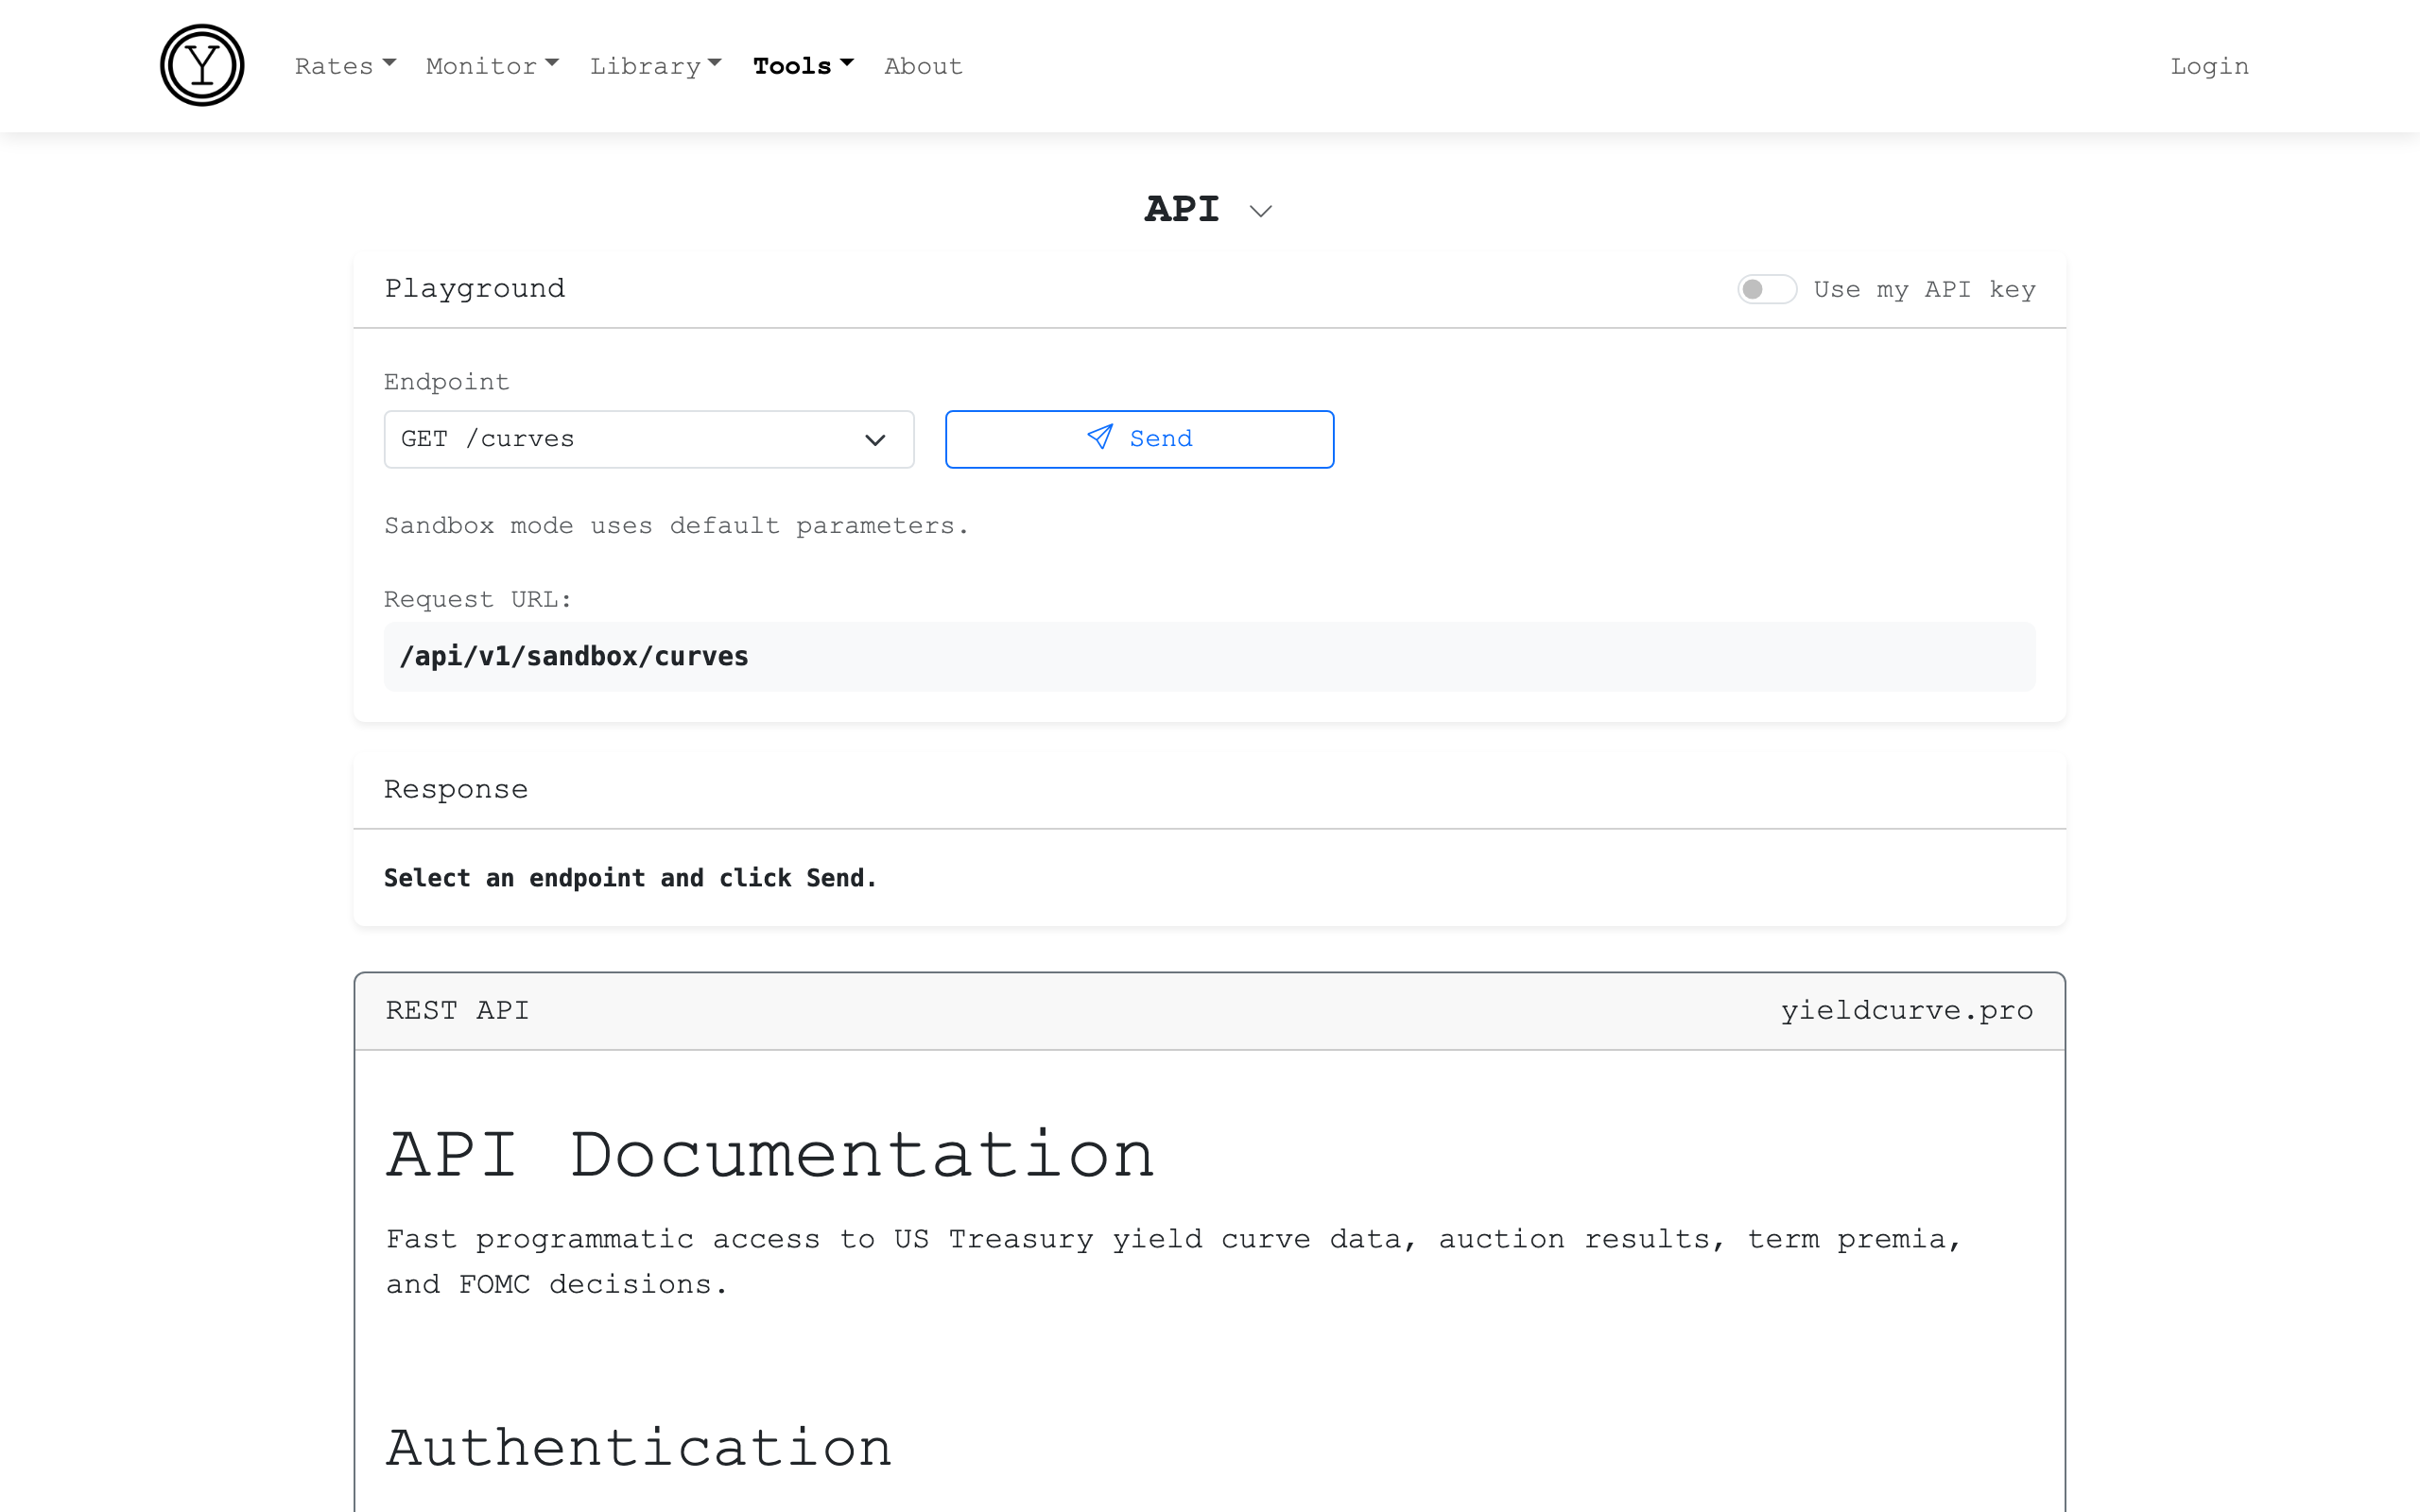
Instructions
- select an Endpoint from the dropdown —
curves,levels,slopes,forwards,premia,regimes,auctions,fed, orhealth - toggle Use my API key to authenticate with your API key — required for extended history and higher rate limits
- click Send to execute the request and view the JSON response
- the URL preview updates as you change the endpoint selection
Endpoints
Market data endpoints (market_data category — available on Free, Standard, and Pro):
/api/curves— daily yield curve snapshots across all standard tenors/api/levels— level changes across tenors/api/slopes— slope (spread) changes across tenor pairs/api/fed— FOMC decisions and effective federal funds rate/api/auctions— Treasury auction results including bid-to-cover and tail
Analytics endpoints (analytics category — Standard and Pro only):
/api/forwards— implied forward rates derived from the current yield curve/api/premia— ACM term premium decomposition (expectations component + risk compensation)/api/regimes— Bull/Bear Flat/Steep regime classification
Tiers
- Sandbox (no key, IP-based) — 10 requests per day; responses truncated to 5 rows
- Free — market data endpoints only; 90 days of history; 10 requests per day
- Standard — market data + analytics; 3 years of history; 100 requests per day (50 per day for analytics)
- Pro — all endpoints; full history to 1990; 500 requests per day (250 per day for analytics)
SweePro subscribers get additional endpoints for completed-month allocation history and monthly performance (SweePro, Oracle, BIL, SHV). The current month's allocation is never exposed via the API.
Notes
- authenticate with an
Authorization: Bearer ycp_...header — all tiers use the same token format - rate limits reset daily at midnight UTC
- the URL preview in the playground shows the unauthenticated form of the request; when "Use my API key" is toggled on, the key is sent in the
Authorizationheader, not the URL - all responses are JSON; dates are ISO 8601 (
YYYY-MM-DD) - sandbox responses are truncated to 5 rows regardless of the date range requested
Use Cases
- pull live yield curve data into a spreadsheet, Python script, or quantitative model
- backfill historical Treasury yields and spreads for research or backtesting
- monitor term premia and regime classifications programmatically
- automate daily data collection for portfolio management or reporting systems
- build dashboards or alerts that trigger when yields, spreads, or regimes cross a threshold
Odds
This page displays implied probabilities from prediction markets for Treasury rate outcomes. Data is sourced from Kalshi and Polymarket.
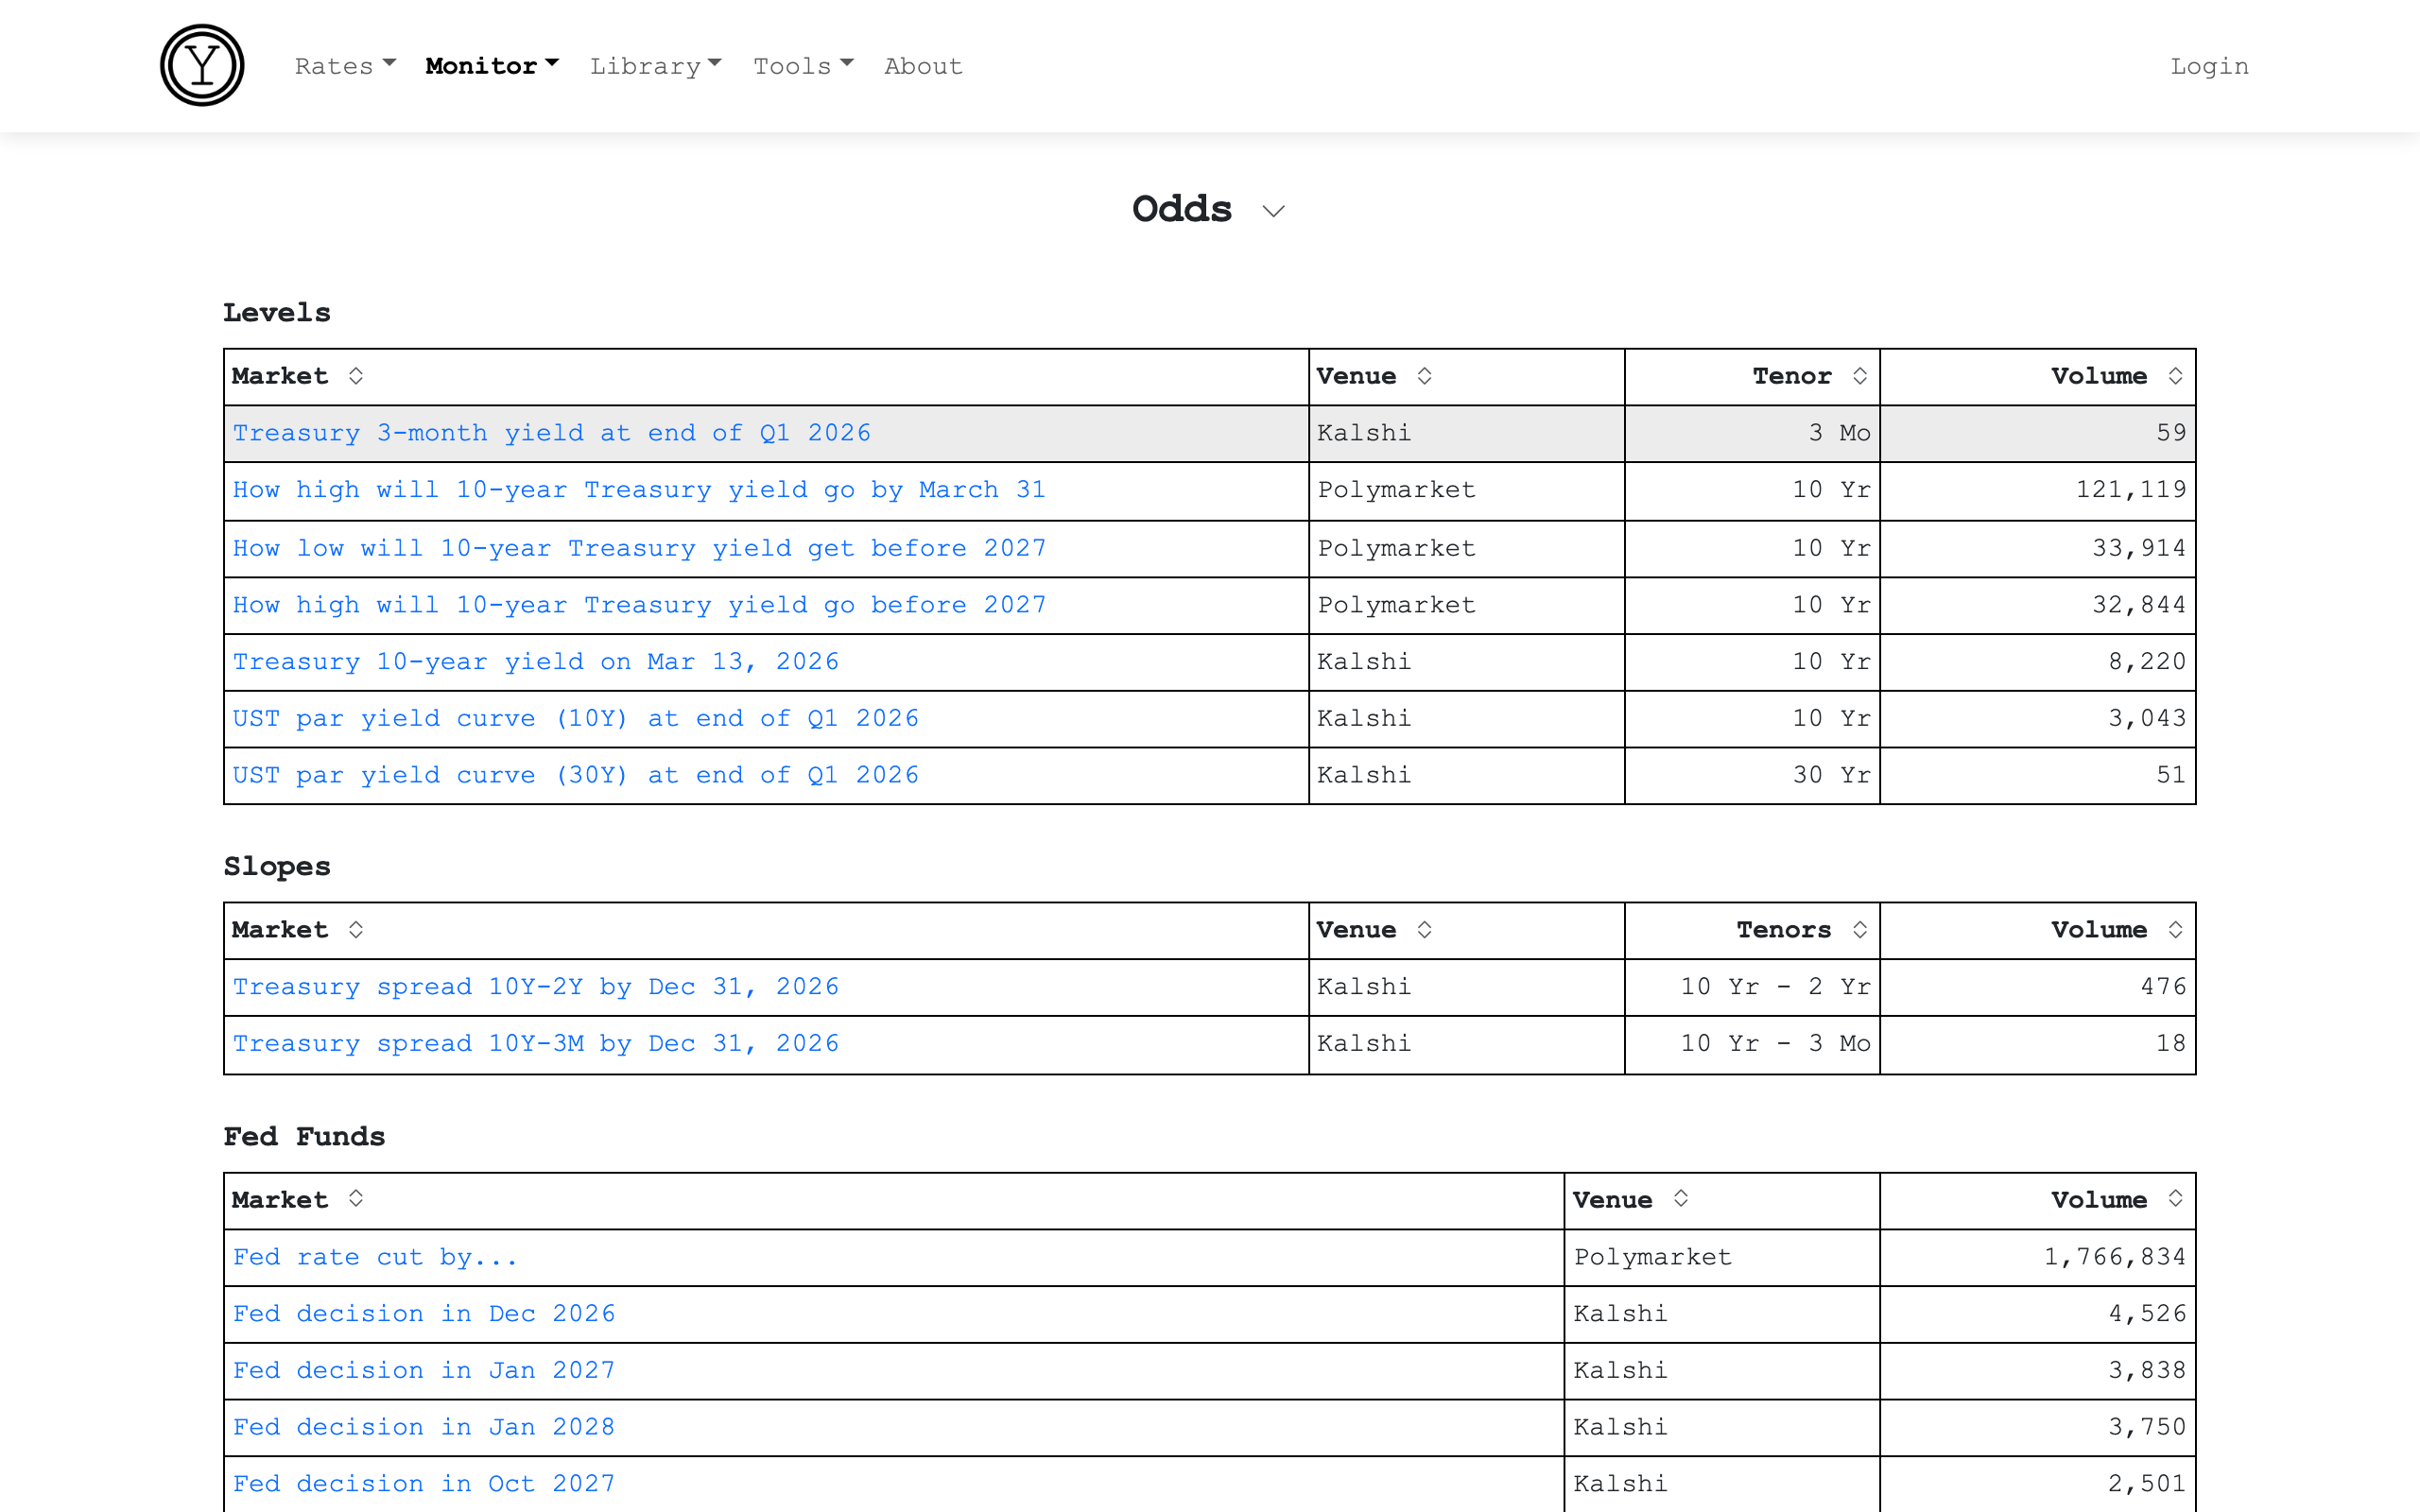
The landing page shows summary tables grouped by Levels, Slopes, and Fed Funds markets. Click any row to see the full detail page with outcome probabilities.
Each outcome row on a detail page has a + button. Click it to set a probability alert: choose whether you want to be notified when the market-implied probability crosses above or below a threshold you specify (e.g., alert me when the probability of a Fed rate cut exceeds 70%). You receive an email the moment the condition is met. One credit is deducted per alert fired. Credits can be purchased from the pricing page.
Markets covered
- Fed Funds Rate - FOMC meeting outcome markets (rate cuts, holds, hikes)
- 10Y Daily / Weekly Yield - bracket markets on the 10-year Treasury yield
- UST Par Yield Curve - quarterly 2Y, 5Y, 10Y, and 30Y par yield levels
- 3Mo T-Bill Yield - quarterly 3-month Treasury bill yield
- 10Y-2Y / 10Y-3M Spreads - yield curve spread threshold markets
Each detail page shows
- Outcome - the strike level or bracket being priced
- Odds - market-implied probability displayed as a bar, from last trade or best ask
- Volume - total contracts traded, shown below the outcomes table
- Chart - trailing yield or spread history, shown below the outcomes for Level and Slope markets
Notes
- probabilities reflect market consensus, not forecasts
- data is sourced directly from Kalshi and Polymarket; refresh frequency is determined by each venue
- click "View on Kalshi" or "View on Polymarket" to see the full market
- click the + button on any outcome row to set a probability alert; 1 credit is charged when the alert fires
Use Cases
- gauge market expectations for Treasury yield movements
- compare prediction market odds with yield curve signals
- monitor curve spread and steepening/flattening probabilities
Further Reading
SweePro
SweePro is a systematic monthly T-bill allocation model for short-duration cash. It ranks Treasury tenors from 1 Mo through 1 Yr and concentrates 100% in the top-ranked tenor. The dashboard, charts, and API show completed months only. The current month's allocation is never published. An independent Treasury research write-up is published each month alongside the track record.
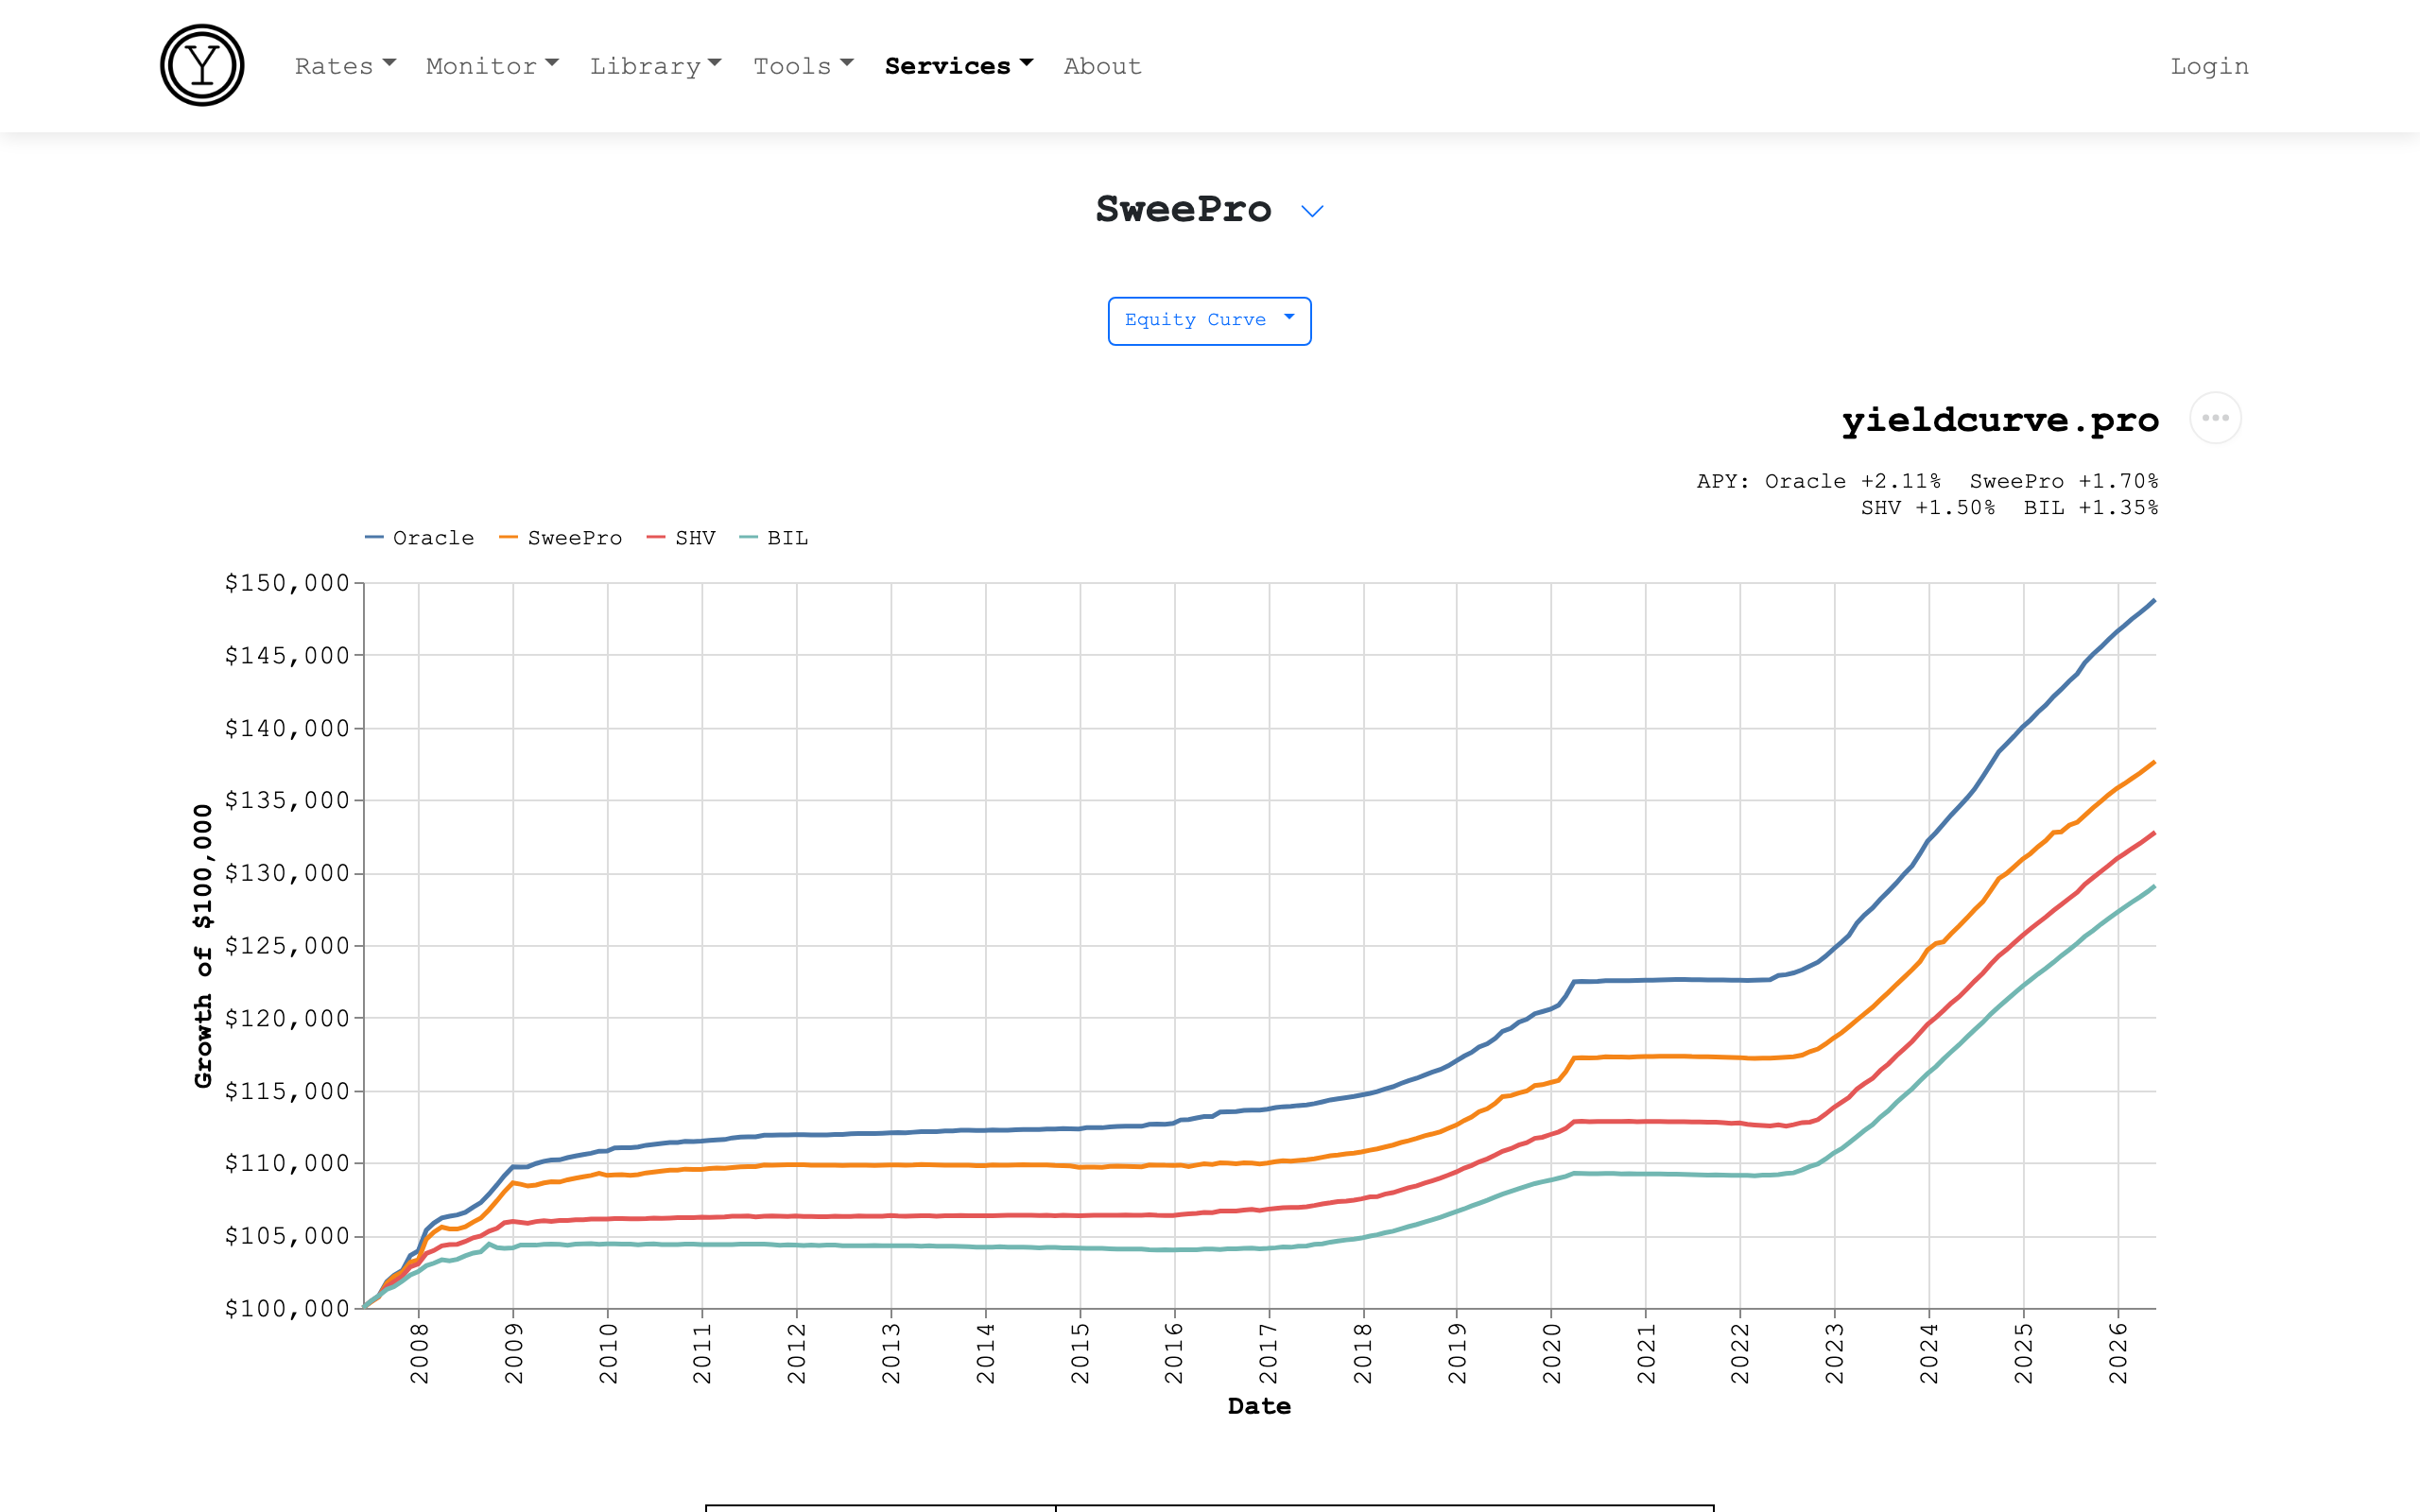
Charts
- Equity Curve - cumulative growth of a $100,000 investment
- Drawdown - peak-to-trough decline over time
- Rolling 12-Month APY - trailing twelve-month annualized return
- Allocation - full completed-month allocation history as a stacked area by tenor
Notes
- Oracle - the theoretical upper bound, always selecting the highest-yielding tenor with perfect foresight
- it is not investable but establishes the best any T-bill strategy can achieve
- SweePro and Oracle are presented net of a hypothetical 12 bps/yr management fee with 0.5 bp slippage per unit of turnover
- BIL (TER 14 bps/yr) and SHV (TER 15 bps/yr) are passive T-bill ETFs used as real-world baselines
- Research and model - the monthly write-up is independent Treasury research
- SweePro is a systematic model output
- the two are separate and can diverge
Subscription
- Monthly - the completed-month track record on the dashboard, all performance and allocation charts, full historical data via API, and the monthly research write-up
- Annual - identical access, billed yearly
Use Cases
- benchmark a T-bill strategy against a systematic baseline and passive ETF alternatives
- study the historical track record of a systematic short-duration allocation
- access the full Oracle and SweePro return history via API
Disclaimer
- all results are hypothetical backtested returns
- past performance is not indicative of future results
- for informational purposes only, not investment advice
- monthly and annual subscribers get identical access
- the difference is billing cadence only
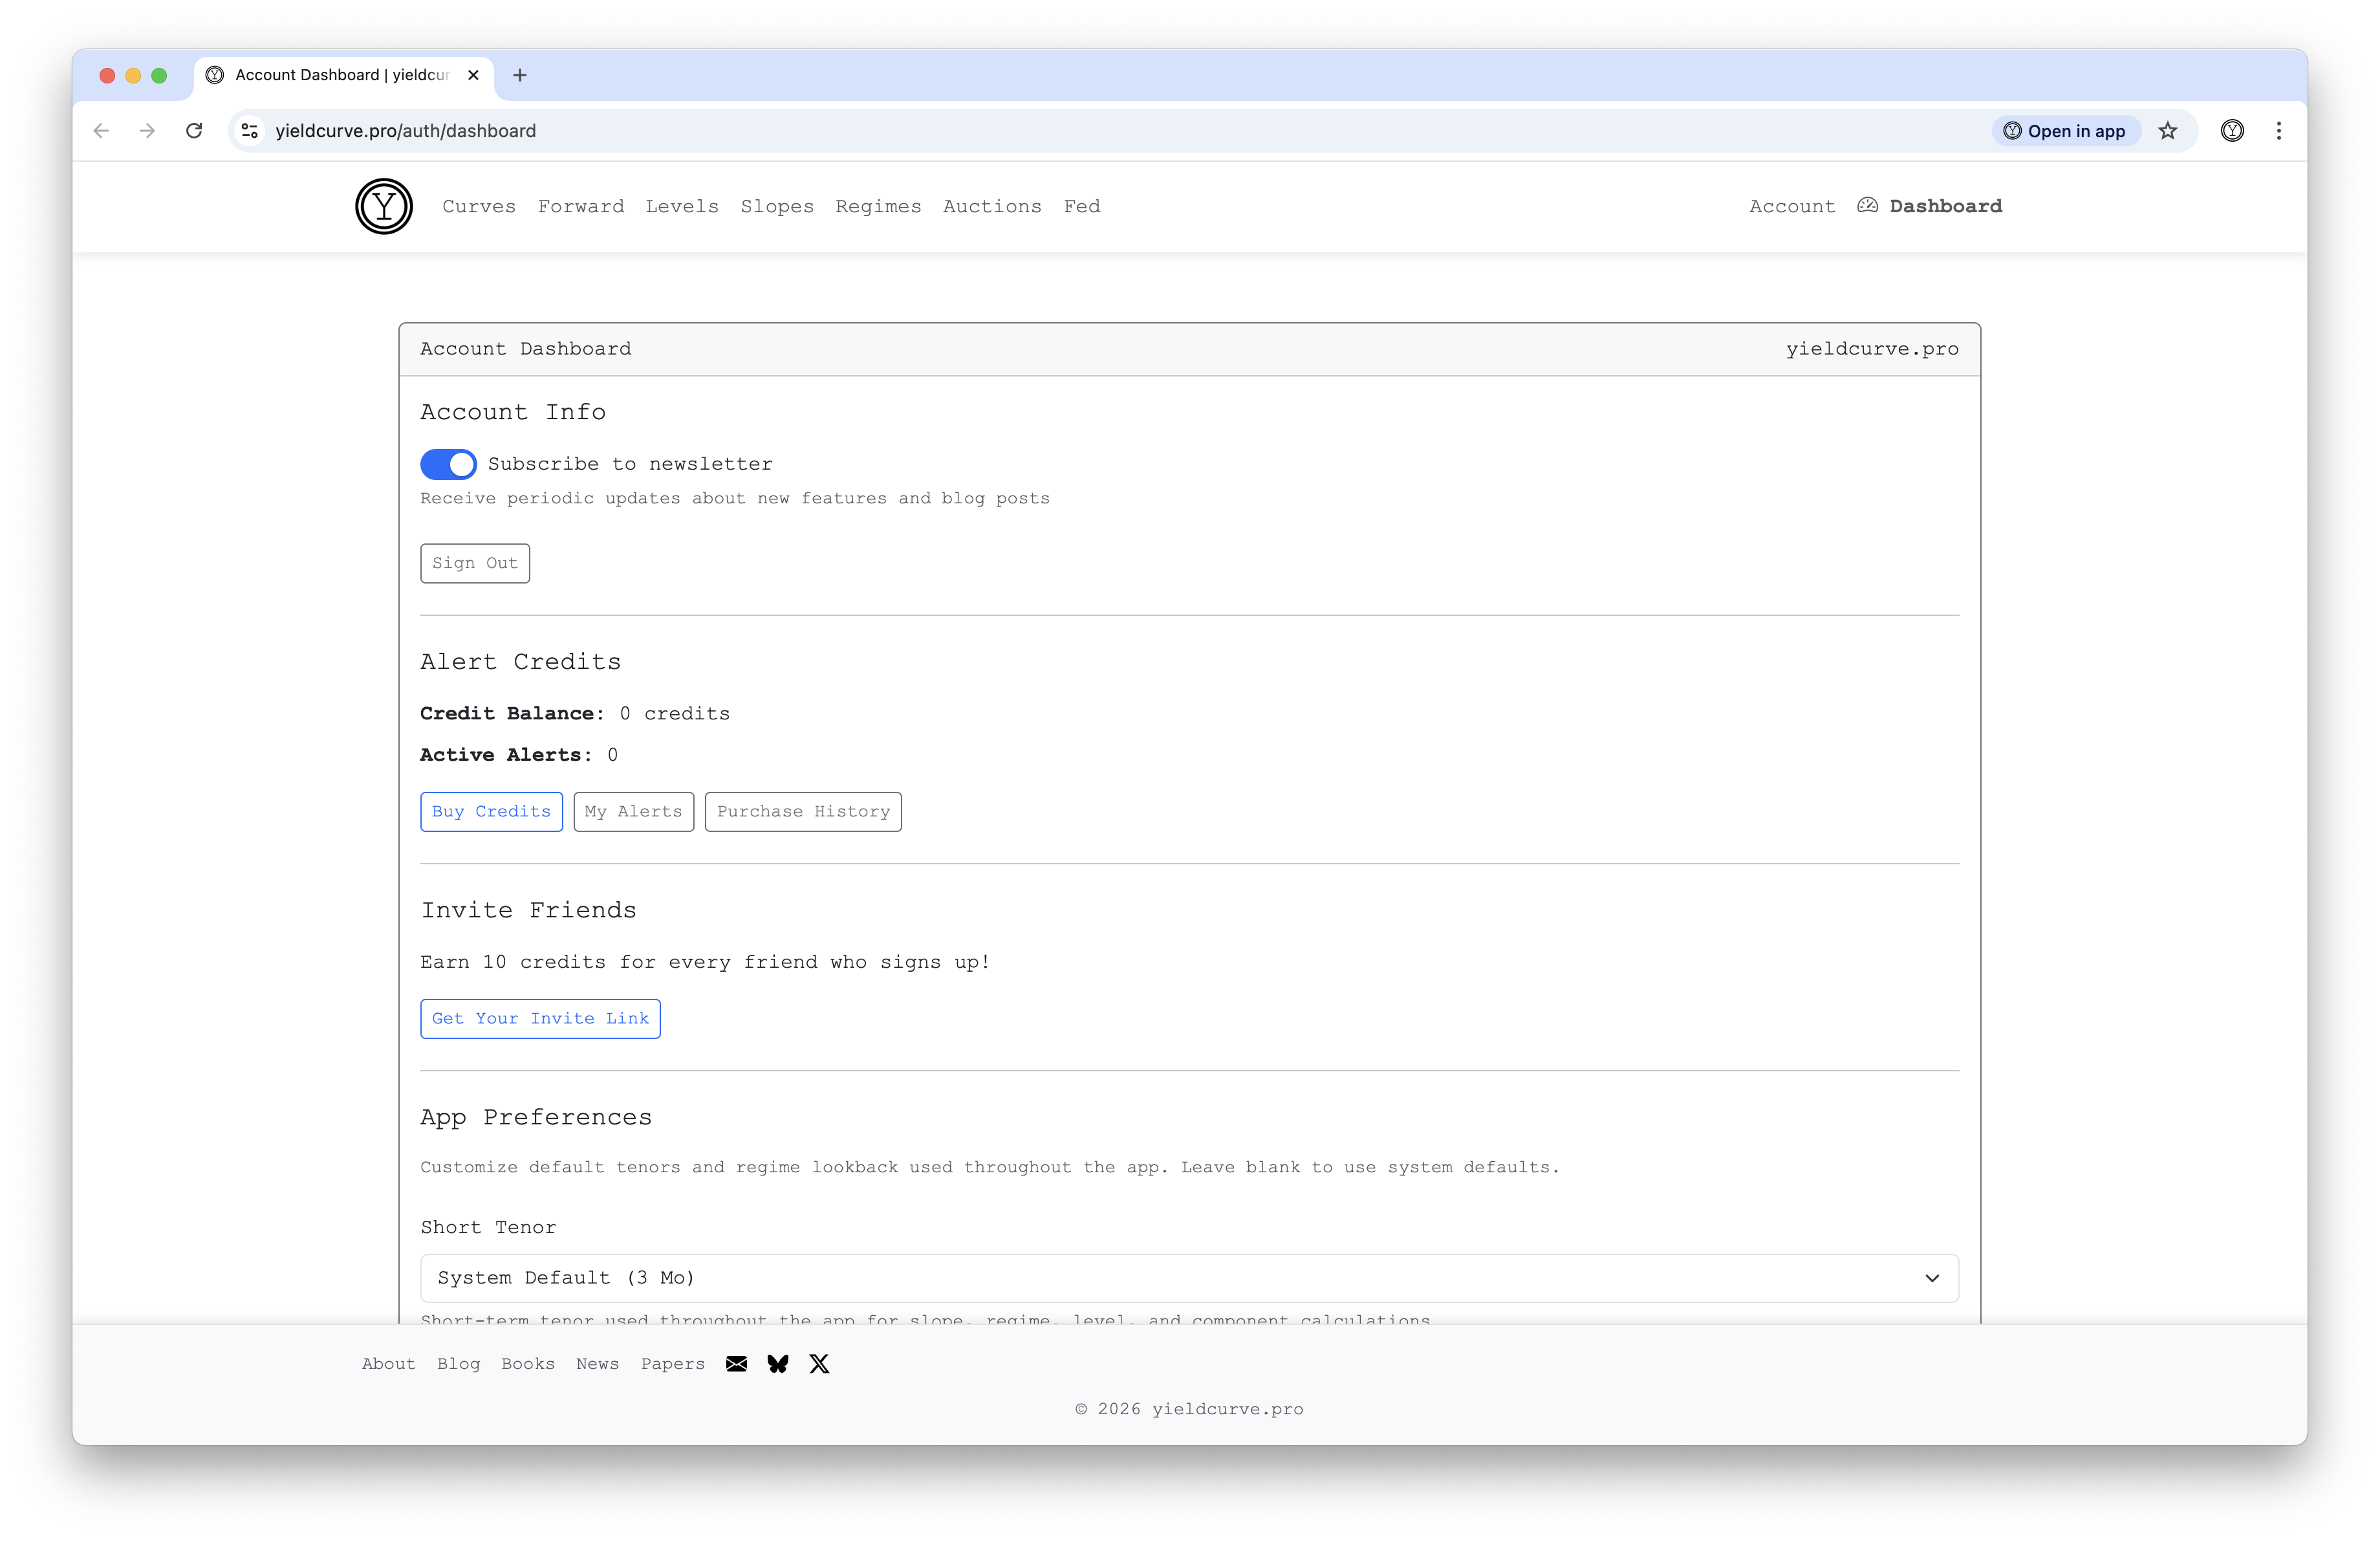
Dashboard
The Morning Dashboard provides registered users with a daily market snapshot, consolidating key yield curve metrics into a single view. Access the dashboard via the Dashboard link in the upper right-hand corner.
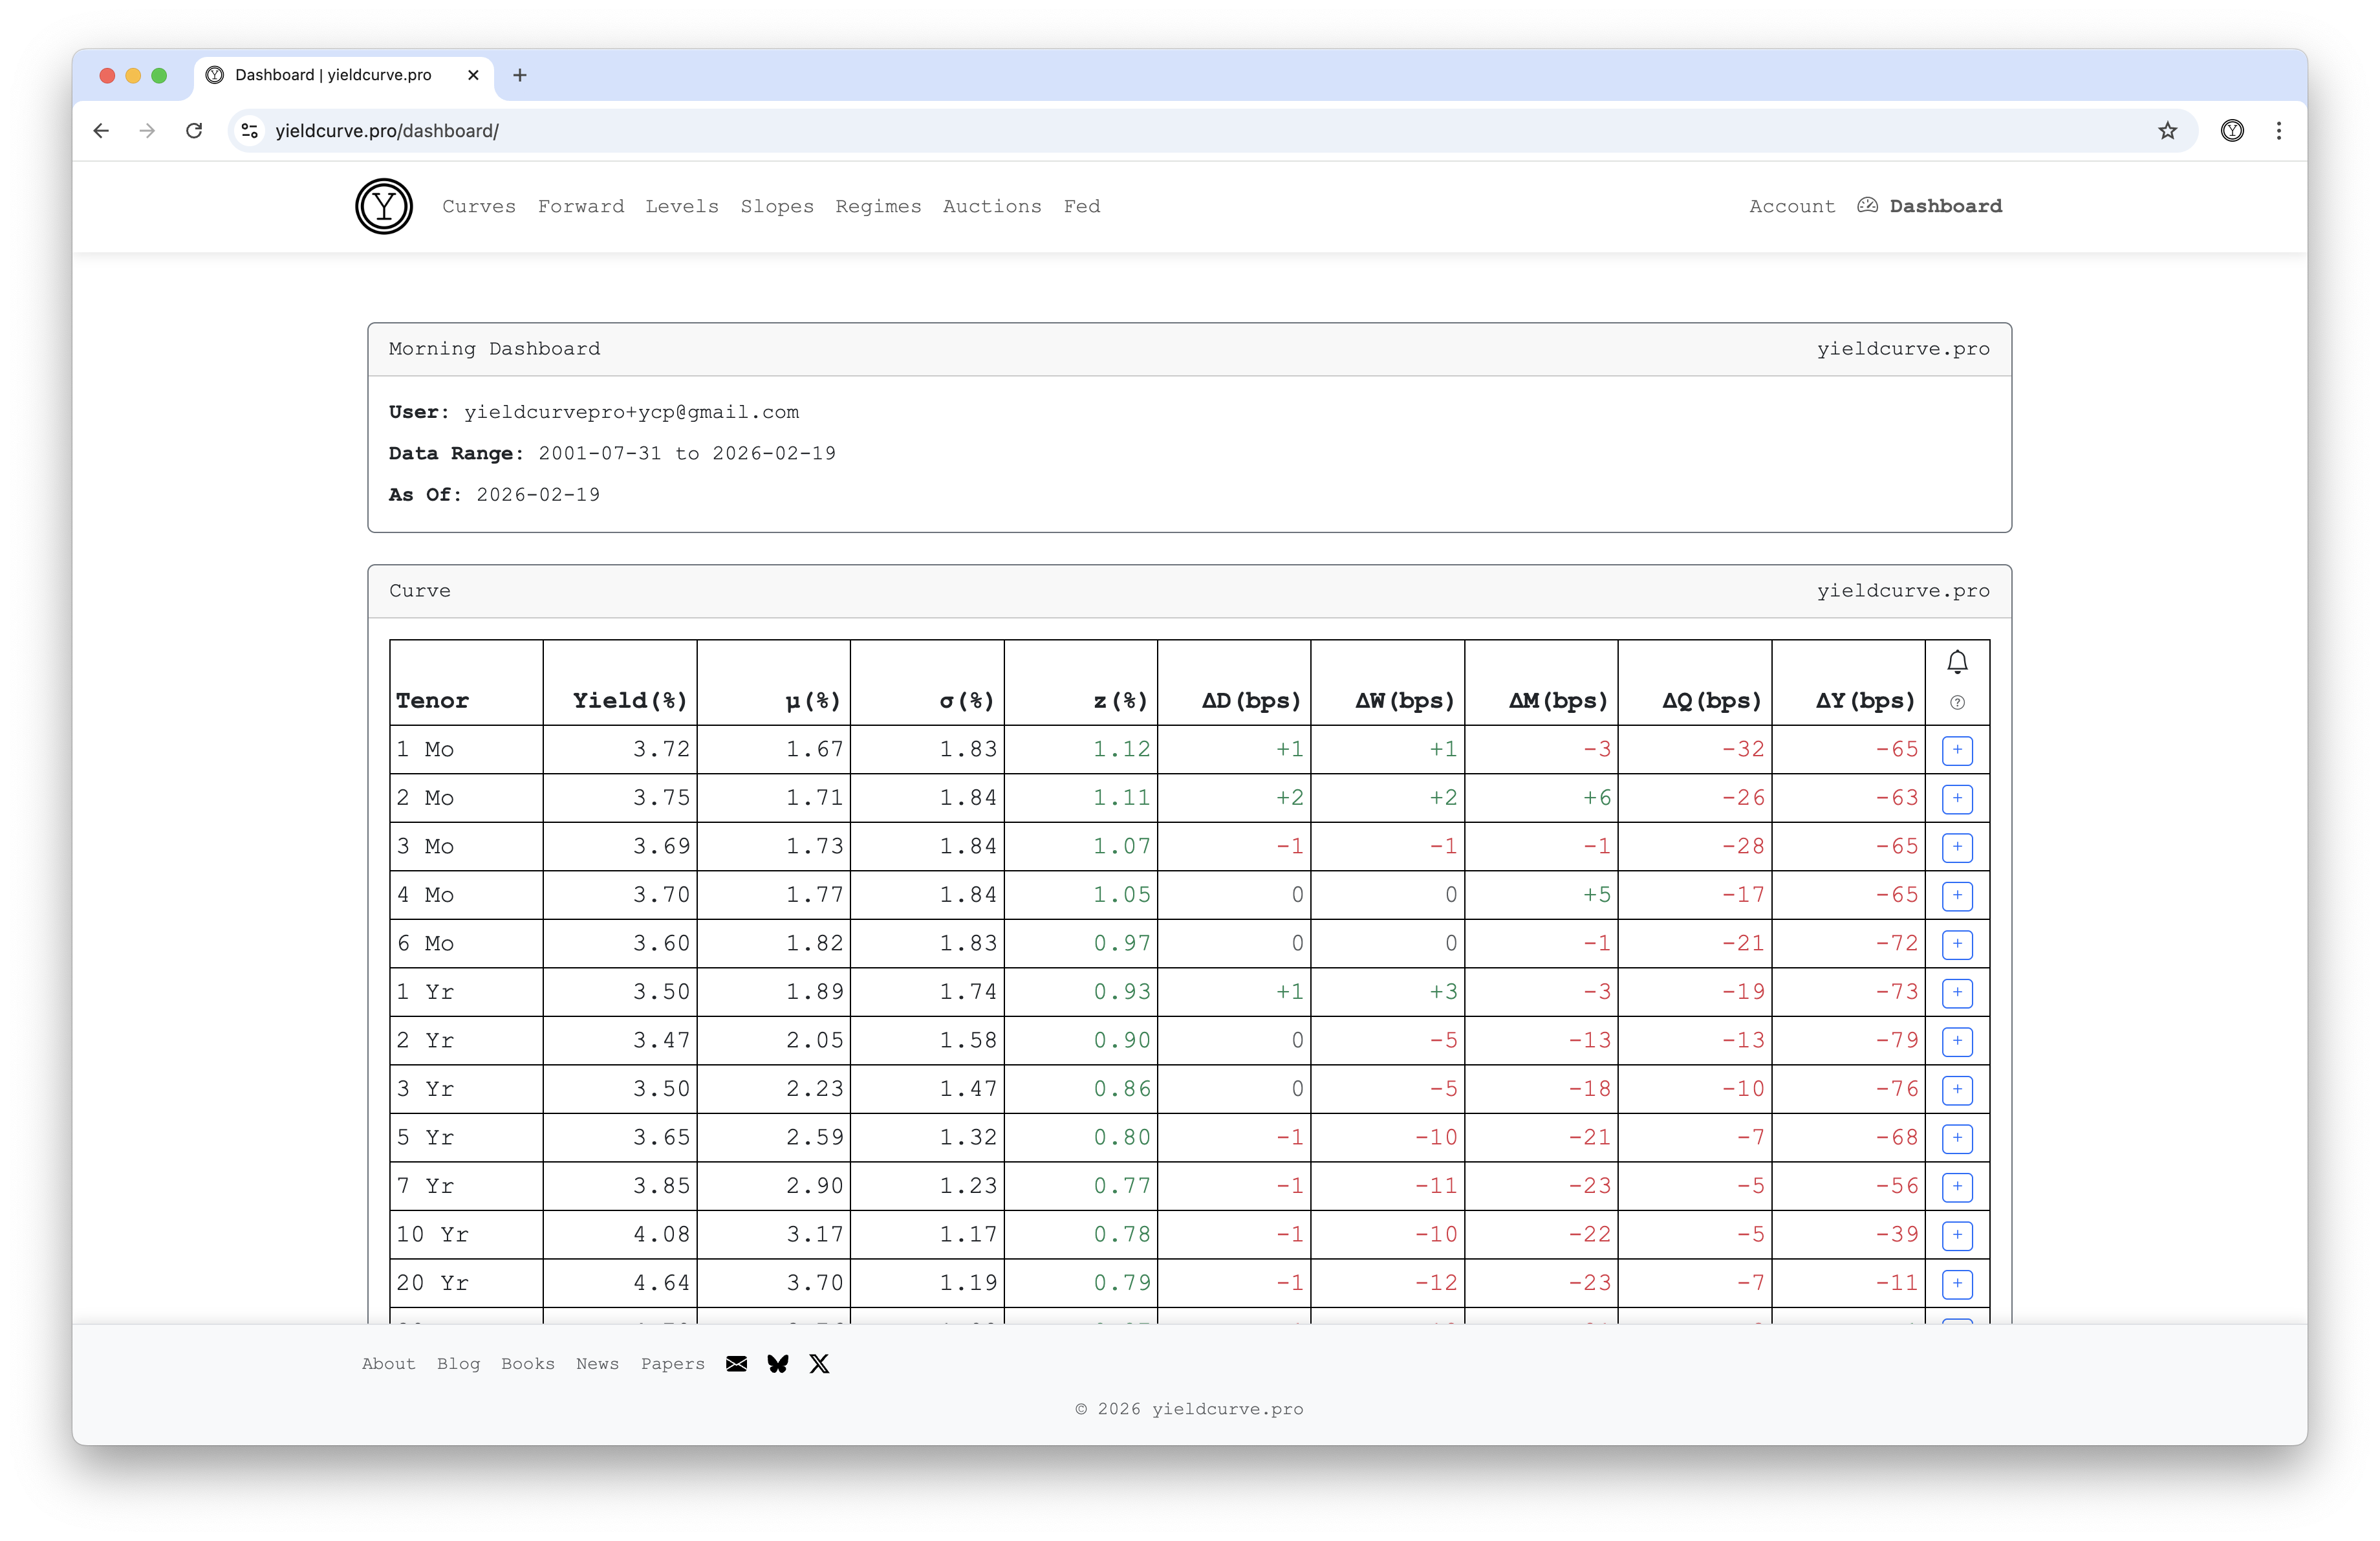
The dashboard includes:
- Overnight Moves - 1-day changes for every tenor, with moves >5bp flagged in color (green for up, red for down)
- Key Spreads - daily changes for headline spreads (2s10s, 3m10y, 2s30s, 5s30s) with inversion status badges
- Alerts Near Trigger - active alerts close to firing, showing current value, threshold, and distance in basis points
- Curve - yields for all tenors with Mean, Std Dev, Z-score, and changes over Day, Week, Month, Quarter, and Year lookback periods
- Level & Slope - the Level (long tenor yield) and Slope (long minus short tenor spread) with Mean, Std Dev, Z-score, and changes over the same lookback periods, using your configured tenor preferences or system defaults (10 Yr and 3 Mo)
- Regimes - the yield curve regime classification at each lookback period (Bull/Bear Steep/Flat), calculated using your configured tenor and regime lookback preferences
- Auctions - recent Treasury auctions with Tail, Bid-to-Cover, Indirect, and Direct percentages, along with letter grades and composite scores
- Fed - current Fed funds target rate with changes over each lookback period
Notes
- positive changes appear in green, negative in red
- auction grades range from D- to A, comparing each metric to historical values
- tenor links in Latest Auctions navigate to the Auctions app for that date
- hovering over column names provides tool-tip text
- Level, Slope, and Regime sections reflect your configured tenor and lookback preferences. Logged-in users can change these via Account Defaults
Use Cases
- quickly assess overnight and recent market movements
- monitor yield curve regime changes and spread inversions
- catch alerts that are about to trigger before they fire
- track recent auction performance at a glance
- identify shifts in Fed policy relative to yield curve conditions
Defaults
Users with accounts can personalize the default tenor and regime lookback settings used throughout the application. Access these settings via your Account page (click the user icon in the upper right corner).
Customizable settings include:
- Short Tenor - short-term tenor used throughout the app for slope, regime, level, and component calculations System default: 3 Mo
- Long Tenor - long-term tenor used throughout the app for level, slope, regime, and component calculations System default: 10 Yr
- Regime Lookback - lookback window in trading days for regime classification System default: 251
Once configured, your preferences will:
- pre-populate dropdown menus in the Levels, Slopes, and Regimes apps
- affect the Level, Slope, and Regime columns in the Fed app
- apply consistently across all charts and data displays
Notes
- leave any field blank to use the system default value
- changes take effect immediately across all apps
- your preferences persist across sessions
Use Cases
- focus on preferred tenors that match your trading or research strategy
- adjust regime lookback periods to match your investment horizon
- quickly switch between different analytical perspectives by updating preferences from your Account page
Newsletter
An email digest covering yield curve developments, auction results, regime changes, and market commentary. The newsletter distills key insights from the site's charting tools and blog into a convenient email format.
We will never share your email address and will send out at most one email each week. To receive the newsletter when it launches, sign up for an account and ensure your email preferences are enabled.
Coming soon!