# Treasury Auction Liquidity
Source: https://www.yieldcurve.pro/blog/treasury-auction-liquidity-001
Published: 2024-01-09
Tags: Auction, Bid to Coverage Ratio, Bills, Bonds, Cash Management Bills (CMB), Floating Rate Notes (FRN), Notes, Treasury Inflation Protected Securities (TIPS), US Treasury
_Monitoring US Treasury Auctions and Issuance to Estimate Security Liquidity_
# Monitoring US Treasury Auctions and Issuance to Estimate Security Liquidity
Figure 1 shows the first post of an excellent Twitter
thread
by
James Lavish.
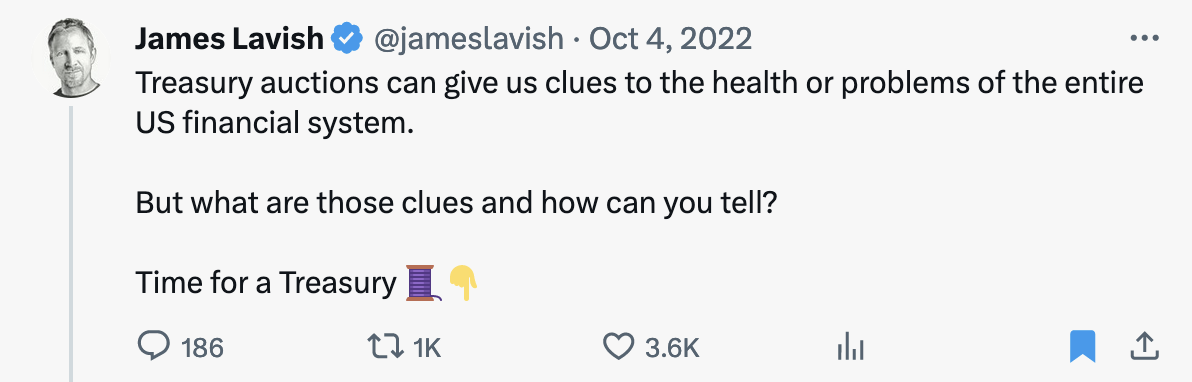 #### **Figure 1**: "Time for a Treasury Thread."
In that thread James provides a primer on the mechanics of US Treasury (UST)
auctions. He begins by giving a refresher on some basic lexicon. For example,
he revisits the naming conventions for different types of securities issued by
UST:
| Security | Tenors | Description |
| :------ | :----------------------------- | :--------------------------------------------- |
| Bills | 4 to 52 weeks | sold at a discount and redeemed at par |
| Notes | 2, 3, 5, 7, 10 years | pay a fixed rate of interest 2X per year |
| Bonds | 20, 30 years | pay a fixed rate of interest 2X per year |
| CMB | less than 1 year | cash management bills for short-term financing |
| TIPS | 5, 10, 30 years | pay a fixed rate on a principal indexed to CPI |
| FRN | 2 years | pay a variable rate of interest 4X per year |
#### **Table 1**: Securities Auctioned and Issued by the US Treasury
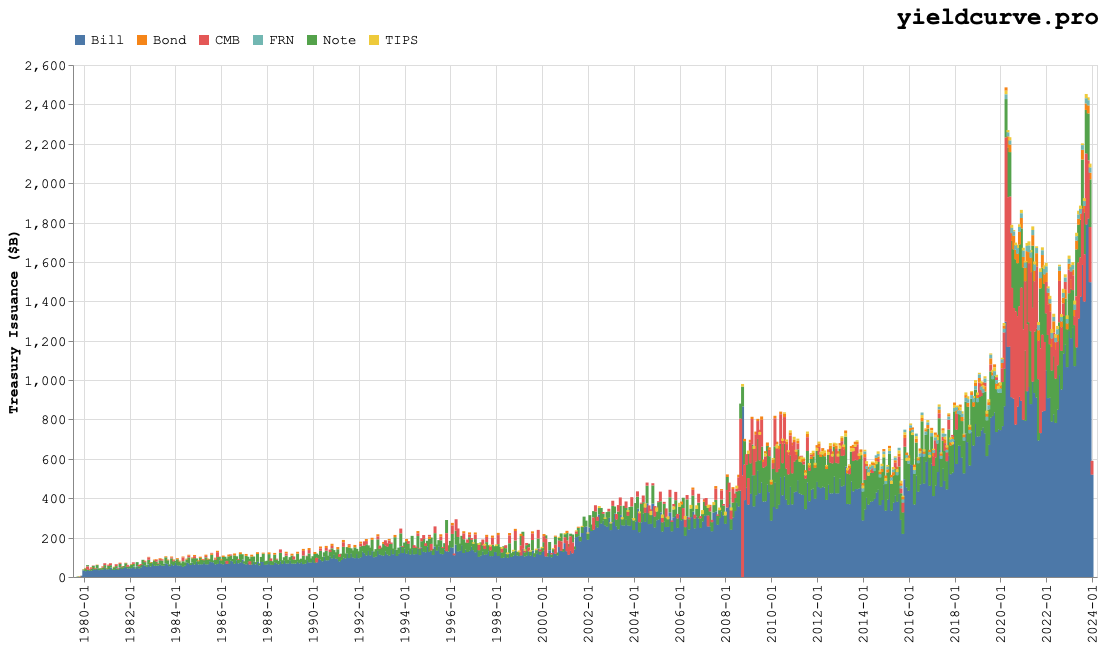
Figure 2 shows the dollar amounts of each security issued each month by UST.
 #### **Figure 2**: Treasury Issuance: 1980 to the present
The various maturities are rolled up for each security type and the bars are
reported, bottom up, starting with the largest dollar issuance and proceding
in decreasing order. We can see that, starting in 1980 and continuing to the
present, that Bills comprise the lion's share of UST issuance followed by
Notes.
Interestingly, there are periods where CMBs figure prominently in overall
issuance. The red regions in Figure 2 reveal that, beginning with the Pandemic
and continuing to the present, CMBs tended to outpace all security issuance
with the exception of Bills. Also, notice that they comprised almost all
issuance for a short period of time around the Great Financial Crisis (GFC).
The most notable feature of Figure 2 is the meteoric rise in issuance beginning
around early 2016 to the present. Bills, Notes, and CMBs appear to play
primary roles in UST fundraising while Bonds, TIPS, and FRNs are secondary.
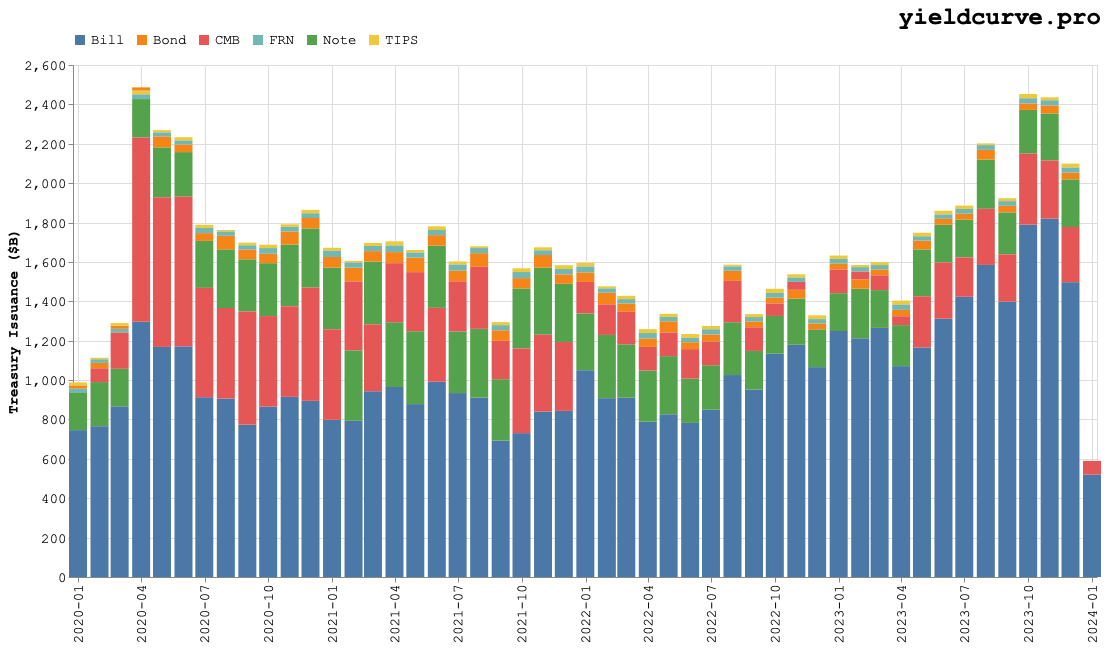
Figure 3 looks at more recent issuance data from 2020 to the present.
 #### **Figure 3**: Treasury Issuance: 2020 to the present
It is apparent that, depending on UST's short term cash mangement needs,
issuance of CMBs spikes and replaces Notes as the second largest security
issued. For example, at the onset of the Pandemic, issuance of CMBs increased
approximatley 5 times month-on-month from March to April of 2020.
It appears that CMB issuance only returned to relatively normal levels
almost 2 years later on January 2022. Those levels have begun to creep up
again starting May 2023. Indeed, in the first month of 2024 security issuance
has been dominated by Bills and CMBs.
It his Twitter
thread
James goes on to describe a few relatively simple statistics that auction
participants use to monitor the health of UST auctions over time.
The first one that we will consider is called the Bid-to-Cover (BTC) ratio
which compares the total dollar amount of bids over the dollar amount of bonds
sold. A BTC of 1 implies that supply (in the form of the dollar amount UST
hopes to raise) was exactly matched by demand (the bids sought by auction
participants).
Obviously, healthier auctions should have BTC greater than 1 because auctions
were over subscribed. James also explains that auction health should be
measured relative to past auction BTCs.
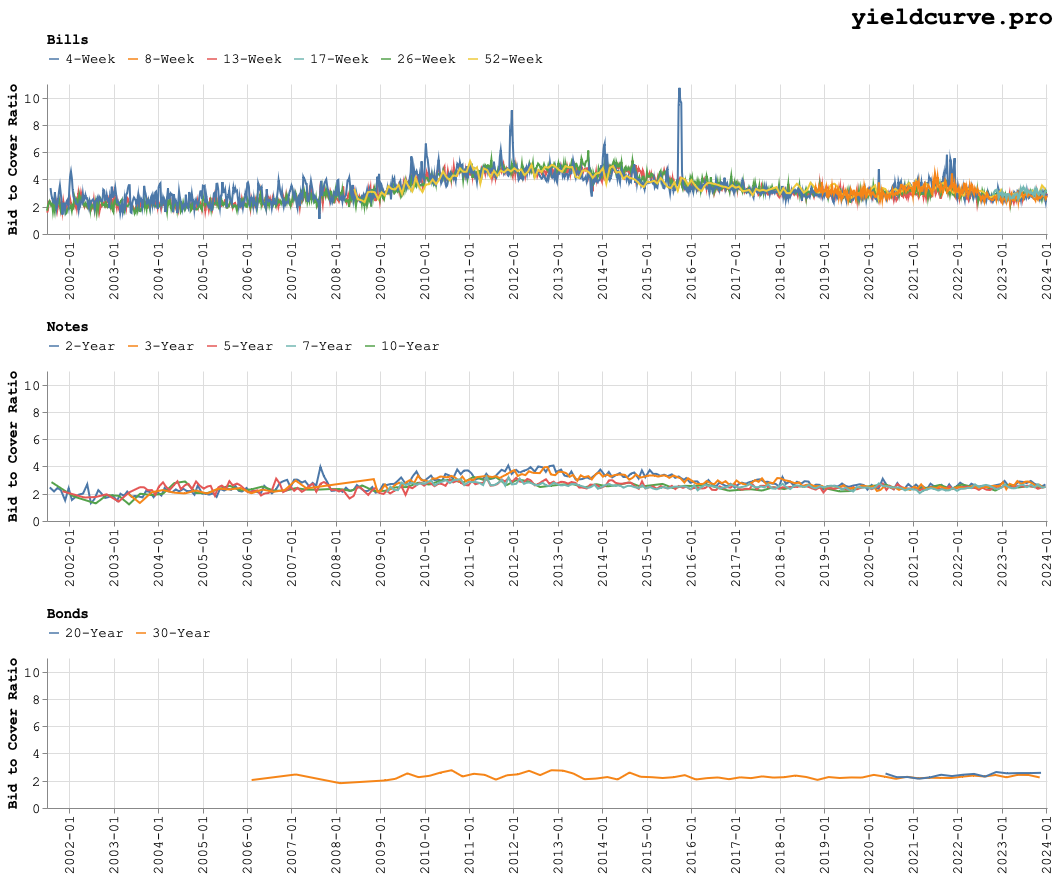
Figure 4 shows BTC for Bills, Notes, and Bonds from 2001 to the present.
 #### **Figure 4**: BTC for Bills, Notes, and Bonds: 2001 to the present
Each panel in Figure 4 superimposes BTC curves at each available tenor.
Irrespective of security type or tenor, their is a remarkable level of
consistency in ratios. From 2001 until the onset of the GFC, ratios hovered
just above 2. Mid 2008 they begain to increase reaching a peak
(between 4 and 6) around 2013. From there, average BTC levels decreased
reaching roughly steady-state around 2019 with levels between 2 and 4.
What does this mean qualitatively? Perhaps that, relative to the previous
decade (2010 to 2020) auction health seems to have deteriorated while relative
to the decade before that (2000-2010) things seems relatively healthy.
To get a better sense of where ratios could be headed we drill down and
look at more recent data. Figure 5 shows BTC from 2020 to the present.
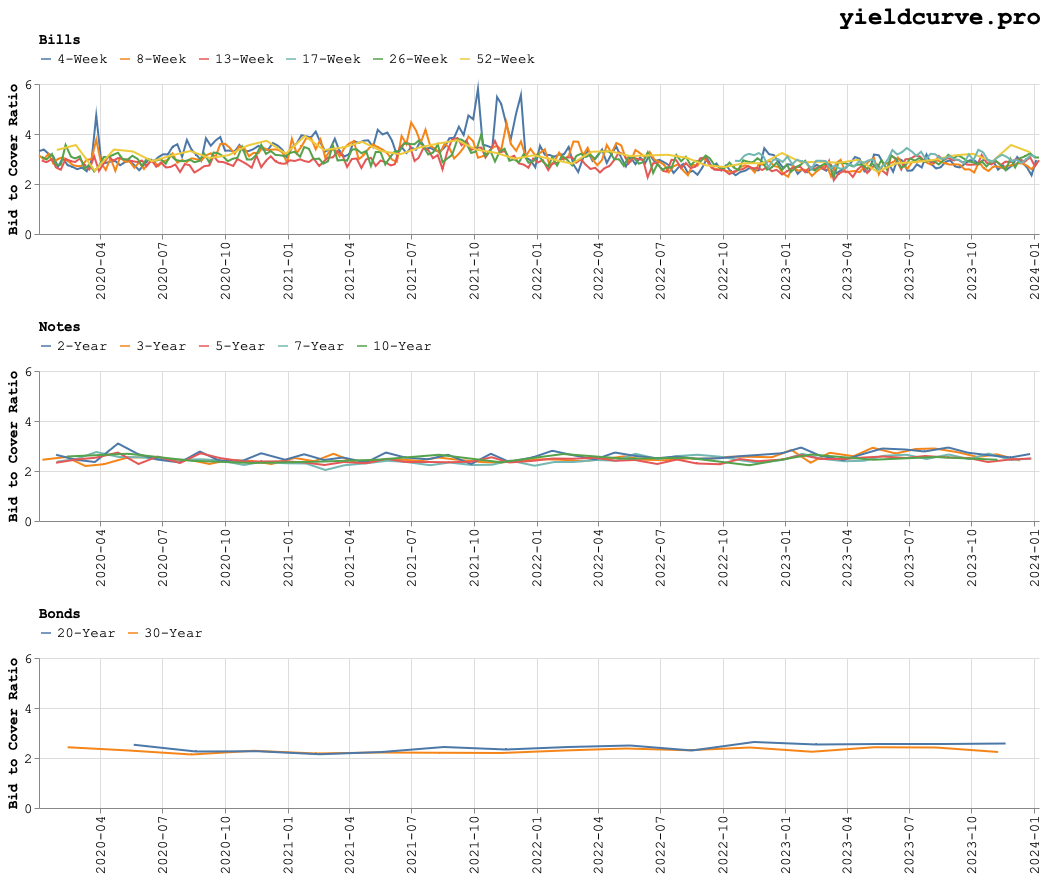 #### **Figure 5**: BTC for Bills, Notes, and Bonds: 2020 to the present
Note and Bond BTC seems to be relatively steady. However, Bill BTC does
exhibit a slight downtrend relative highs around the end of 2021. As we
have seen, Bill issuance is the workhouse with respect to UST fundraising.
Perhaps we have reason to worry. As Mr Lavish indicated in his thread, this is
a statistic well worth monitoring in the coming days.
Thank you for reading and until then!
Related reading: Bid-to-Cover Explained: What Treasury Auction Demand Looks Like Across the Curve.