What do current market movements in stocks and bonds have to say about 60/40 fund weights?
As the name implies, these are funds that are comprised of 60% stocks and 40% bonds. They are intended to provide reliable risk-adjusted return streams via diversification of stocks and bonds. The way it works is that the initial relative values (or weights) of stocks and bonds are set at 60% and 40%, respectively. Periodically, if stocks have returned more than bonds, stocks are sold in order to restore equilibrium and vice-versa.
It is interesting to look at the historical drift in equilibrium weights on a period-by-period basis. Consider the following experiment: track the cumulative return of a given stock and bond index (say SPY and TLT) every month. Next, combine that data to estimate a one standard deviation envelope of weights (for stocks and bonds) as a function of the days in any given month. Then estimate, for the current point-in-time, how out of equilibrium the 60-40 weights are as a normalized distance from average (or z-score). This allows us to estimate how much (in weight space) a typical 60-40 fund needs to move in order to restore equilibrium.
The chart in Figure 1 captures all of this information.
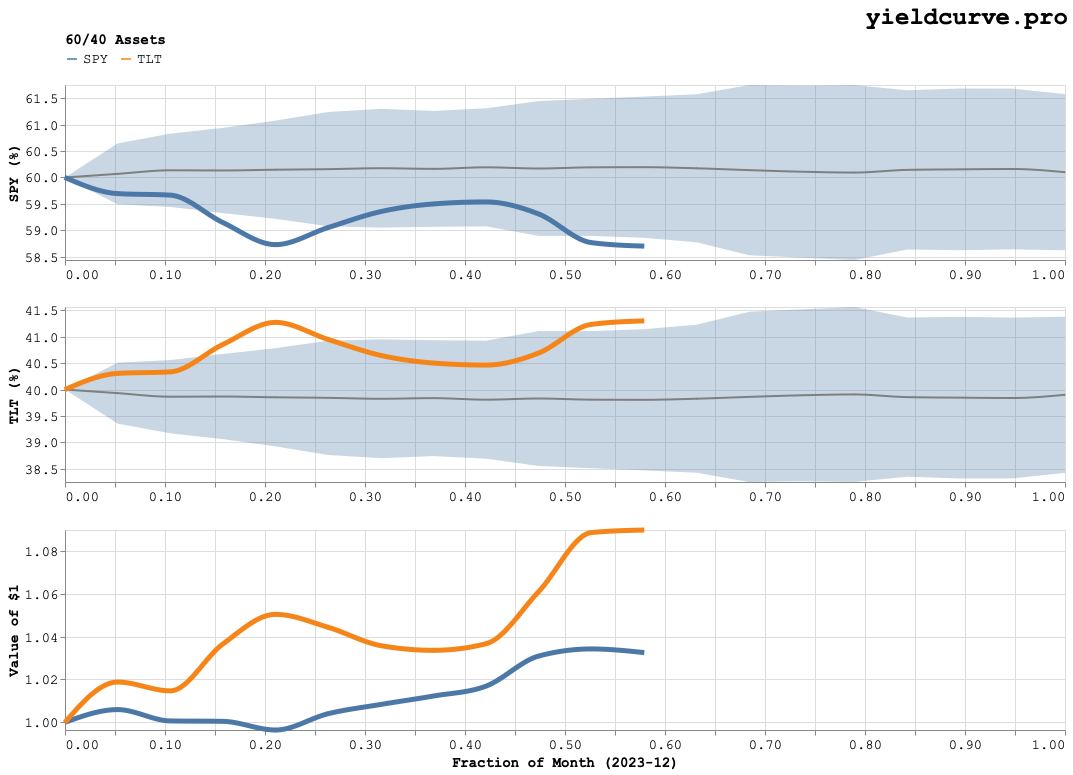
Figure 1: Stock/Bond Weights For December 2023
It shows that historically, stocks (SPY) have drifted higher than bonds (TLT) by about 10 basis points on average (the solid gray lines) on a monthly basis. The chart also shows that a one standard deviation move in weights amounts to about a 150 basis point change in either direction. Last, we can say the following about the most recent month (represented by the blue and orange lines):
- stocks and bonds have both experienced strong positive performance this month
- stocks and bonds have both experienced strong positive performance this month
- bonds have outperformed stocks
- exposure to stocks needs to increase by approximately 125 basis points in order to restore equilibrium amounting to more than a 1.0 imbalance in standard deviation (z-score) space
- naively this implies that 60-40 funds would be buyers of stocks and sellers of bonds at month end
Back