Asset Returns During Various Yield Curve Regimes
We are curious which assets perform best in the months following the four yield curve regimes. As a reminder, they are Bear Flattener, Bear Steepener, Bull Flattener, and Bull Steepener. For a refresher on these refer to this post.
In order to answer these questions we conducted a simple study. First, we decompose the US Yield Curve into Level (proxied with the 10 Yr) and Slope (proxied by the 10 Yr - 3 Mo) components and determine the regime using a 6 Mo look back window. Next we determine which regime was most prevalent in a given month and then compute the returns for a set of securities over the subsequent month.
At the moment, as we can see from Figure 1, we are the midst of a Bear Steepener.
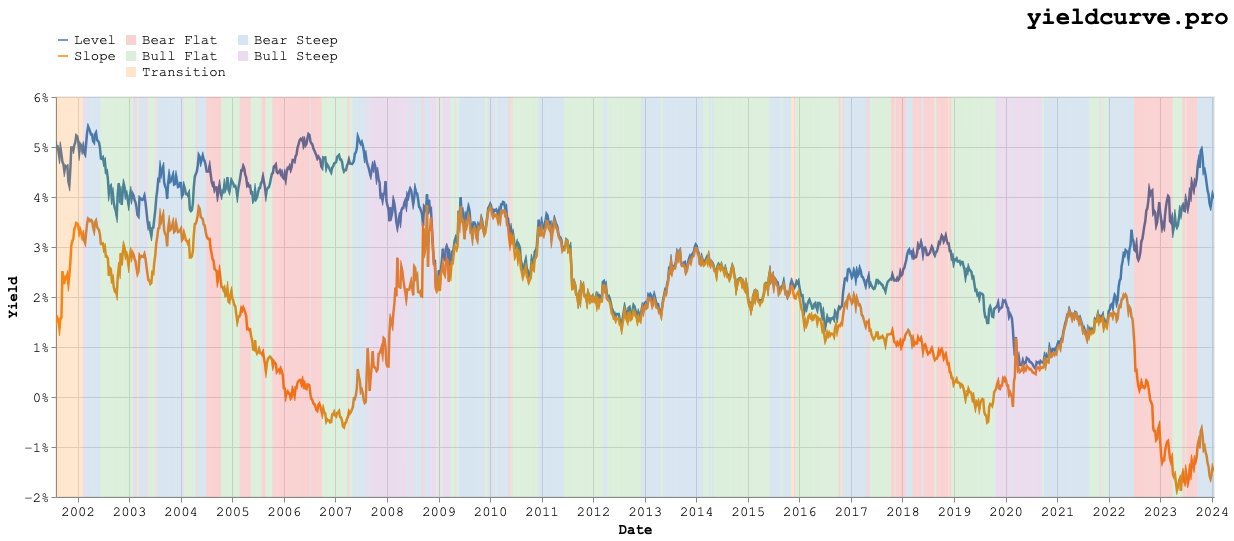
Figure 1: Yield Curve Regimes: 2001 to the Present
So which asset classes perform best in this regime?
In this particular study we considered an assortment of fixed-income, equity, and sector ETFs. Why these? The first reason is that these are a set of securities that cover different broad based indices and, therefore, provided an interesting story and some basic insights into how changes in the yield curve resulted in different outcomes. The second reason is that they were (and are) easily investible by your average retail investor. This resulted in the following arbitrary universe of ETFs.
Tables 1 through 4 show the different ETFs we consider.
| Ticker | Description |
|---|---|
| SHV | iShares 1-12 Months Treasury |
| SHY | iShares 1-3 Year Treasury |
| IEI | iShares 3-7 Year Treasury |
| IEF | iShares 7-10 Year Treasury |
| TLT | iShares 20+ Year Treasury |
Table 1: Rates ETFs
| Ticker | Description |
|---|---|
| AGG | iShares Core U.S. Aggregate |
| HYG | iShares iBoxx $ High Yield Corporate |
| LQD | iShares iBoxx $ Inv Grade Corporate |
Table 2: Credit ETFs
| Ticker | Description |
|---|---|
| SPY | SPDR S&P 500 |
| QQQ | Invesco Nasdaq 100 |
| IWF | iShares Russell 1000 Growth |
| IWD | iShares Russell 1000 Value |
| IWM | iShares Russell 2000 |
| EFA | iShares MSCI EAFE |
| SCZ | iShares MSCI EAFE Small Cap |
| EEM | iShares MSCI Emerging Markets |
Table 3: Equity ETFs
Global Industry Classification Standard
The Global Industry Classification Standard (GICS) is an equity classification created by MSCI in 1999. XLC and XLRE were created more recently and have much less data so any inference with respect to these should be taken with a grain of salt.
| Ticker | Description |
|---|---|
| XLC | Communication Services |
| XLY | Consumer Discretionary |
| XLP | Consumer Staples |
| XLE | Energy |
| XLF | Financials |
| XLV | Health Care |
| XLI | Industrials |
| XLB | Materials |
| XLRE | Real Estate |
| XLK | Technology |
| XLU | Utilities |
Table 4: GICS ETFs
Summary Statistics
We report absolute and risk-adjusted returns as a function of yield curve regime for each asset class. Returns were annualized and reported in percent and are shown in Tables 5 through 8.
| Ticker | Bear Flattener | Bear Steepener | Bull Flattener | Bull Steepener | Start | End |
|---|---|---|---|---|---|---|
| SHV | 1.91% | 0.92% | 0.65% | 1.93% | 2007 | 2024 |
| SHY | 1.38% | 2.26% | 1.12% | 2.75% | 2002 | 2024 |
| IEF | -0.39% | 6.56% | 3.78% | 4.41% | 2002 | 2024 |
| IEI | -0.50% | 4.49% | 3.14% | 3.48% | 2007 | 2024 |
| TLT | -3.55% | 9.85% | 8.51% | 3.00% | 2002 | 2024 |
Table 5: Rates Annualized Percent Returns
| Ticker | Bear Flattener | Bear Steepener | Bull Flattener | Bull Steepener | Start | End |
|---|---|---|---|---|---|---|
| AGG | 1.27% | 2.75% | 2.60% | 7.40% | 2003 | 2023 |
| HYG | 2.00% | 7.45% | 8.30% | -5.84% | 2007 | 2023 |
| LQD | 1.19% | 4.54% | 6.55% | 5.38% | 2002 | 2023 |
Table 6: Credit Annualized Percent Returns
| Ticker | Bear Flattener | Bear Steepener | Bull Flattener | Bull Steepener | Start | End |
|---|---|---|---|---|---|---|
| SPY | -3.77% | 18.39% | 12.71% | 13.53% | 2001 | 2024 |
| QQQ | -4.80% | 22.90% | 16.30% | 26.23% | 2001 | 2024 |
| IWF | -5.67% | 19.97% | 14.27% | 18.75% | 2001 | 2024 |
| IWD | -3.06% | 17.63% | 10.76% | 10.62% | 2001 | 2024 |
| IWM | -7.05% | 20.56% | 8.68% | 23.28% | 2001 | 2024 |
| EFA | -5.46% | 16.99% | 8.89% | 11.22% | 2001 | 2024 |
| SCZ | -21.57% | 17.31% | 8.41% | 16.65% | 2007 | 2024 |
| EEM | -3.02% | 14.91% | 12.30% | 28.17% | 2003 | 2024 |
Table 7: Equity Annualized Percent Returns
| Ticker | Bear Flattener | Bear Steepener | Bull Flattener | Bull Steepener | Start | End |
|---|---|---|---|---|---|---|
| XLC | -13.63% | 34.61% | 5.47% | 37.45% | 2018 | 2024 |
| XLY | -4.91% | 20.47% | 12.40% | 19.87% | 2001 | 2024 |
| XLP | -3.28% | 15.25% | 11.44% | 7.79% | 2001 | 2024 |
| XLE | 5.68% | 12.60% | 12.30% | 21.51% | 2001 | 2024 |
| XLF | -6.11% | 19.12% | 12.14% | 8.48% | 2001 | 2024 |
| XLV | 0.03% | 19.69% | 12.89% | 6.87% | 2001 | 2024 |
| XLI | -4.19% | 20.17% | 10.58% | 16.93% | 2001 | 2024 |
| XLB | -8.35% | 14.69% | 12.10% | 28.92% | 2001 | 2024 |
| XLRE | -8.28% | 30.18% | 3.14% | 31.00% | 2015 | 2024 |
| XLK | -4.60% | 21.44% | 17.47% | 23.05% | 2001 | 2024 |
| XLU | -1.79% | 15.83% | 12.72% | 8.92% | 2001 | 2024 |
Table 8: GICS Annualized Percent Returns
For risk-adjusted return we simply used the ratio of annualized return to annualized volatility. As such, these are not to be confused with true Sharpe Ratios but, rather, should be viewed more as signal-to-noise ratios. they are shown in Tables 9 through 12.
| Ticker | Bear Flattener | Bear Steepener | Bull Flattener | Bull Steepener | Start | End |
|---|---|---|---|---|---|---|
| SHV | 3.90 | 3.07 | 2.45 | 4.41 | 2007 | 2024 |
| SHY | 0.71 | 1.75 | 1.00 | 1.48 | 2002 | 2024 |
| IEF | -0.05 | 0.99 | 0.57 | 0.60 | 2002 | 2024 |
| IEI | -0.09 | 1.15 | 0.88 | 0.76 | 2007 | 2024 |
| TLT | -0.26 | 0.72 | 0.53 | 0.22 | 2002 | 2024 |
Table 9: Rates Annualized Return / Volatility
| Ticker | Bear Flattener | Bear Steepener | Bull Flattener | Bull Steepener | Start | End |
|---|---|---|---|---|---|---|
| AGG | -0.10 | 1.24 | 0.65 | 1.00 | 2003 | 2024 |
| HYG | -0.56 | 1.08 | 0.72 | 0.76 | 2007 | 2024 |
| LQD | -0.36 | 1.37 | 0.67 | 1.13 | 2002 | 2024 |
Table 10: Credit Annualized Percent Returns
| Ticker | Bear Flattener | Bear Steepener | Bull Flattener | Bull Steepener | Start | End |
|---|---|---|---|---|---|---|
| EEM | -0.09 | 0.55 | 0.51 | 0.92 | 2003 | 2024 |
| EFA | -0.24 | 0.86 | 0.43 | 0.48 | 2001 | 2024 |
| IWD | -0.15 | 0.96 | 0.57 | 0.44 | 2001 | 2024 |
| IWF | -0.24 | 0.95 | 0.77 | 0.82 | 2001 | 2024 |
| IWM | -0.29 | 0.90 | 0.38 | 0.84 | 2001 | 2024 |
| QQQ | -0.18 | 1.21 | 0.82 | 0.94 | 2001 | 2024 |
| SCZ | -0.89 | 0.90 | 0.40 | 0.68 | 2007 | 2024 |
| SPY | -0.17 | 1.10 | 0.71 | 0.60 | 2001 | 2024 |
Table 11: Equities Annualized Return / Volatility
| Ticker | Bear Flattener | Bear Steepener | Bull Flattener | Bull Steepener | Start | End |
|---|---|---|---|---|---|---|
| XLB | -0.35 | 0.69 | 0.53 | 1.02 | 2001 | 2024 |
| XLC | -0.51 | 2.14 | 0.19 | 1.69 | 2018 | 2024 |
| XLE | 0.17 | 0.48 | 0.43 | 0.64 | 2001 | 2024 |
| XLF | -0.22 | 0.72 | 0.49 | 0.21 | 2001 | 2024 |
| XLI | -0.20 | 1.09 | 0.51 | 0.65 | 2001 | 2024 |
| XLK | -0.17 | 1.15 | 0.85 | 0.80 | 2001 | 2024 |
| XLP | -0.20 | 1.22 | 0.79 | 0.48 | 2001 | 2024 |
| XLRE | -0.41 | 1.98 | 0.12 | 1.28 | 2015 | 2024 |
| XLU | -0.08 | 0.95 | 0.68 | 0.40 | 2001 | 2024 |
| XLV | 0.00 | 1.36 | 0.73 | 0.36 | 2001 | 2024 |
| XLY | -0.20 | 1.03 | 0.64 | 0.76 | 2001 | 2024 |
Table 12: GICS Annualized Return / Volatility
Conclusion
Initially, we set out to discover a few easily tradable ETFs that tend to perform well in months following a bear steepener. To this end, we conducted an extremely simplistic (perhaps even naive) analysis which resulted in a relatively interesting short list of ETFs to hold.
The top 1 or 2 ETFs in each bucket are shown in Figure 10.
| Ticker | Description | Asset Class |
|---|---|---|
| SHV | iShares 1-12 Months Treasury | Rates |
| SHY | iShares 1-3 Year Treasury | Rates |
| LQD | iShares iBoxx $ Inv Grade Corporate | Credit |
| SPY | SPDR S&P 500 | Equities |
| QQQ | Invesco Nasdaq 100 | Equities |
| XLP | Consumer Staples | GICS |
| XLV | Health Care | GICS |
Table 13: Post Bear Steepener Friendly ETFs
We internationally excluded GICS ETFs (XLC and XLRE) with insufficiently long histories. The best performing assets have been cherry picked using risk-adjusted returns.
Notice that in the months following a bear steepener that rates at the front of the curve d risk assets perform reasonably well. It is worth noting that on an absolute basis long dated rates also perform very well in the months following as well. This could be do performance of the assets reversing after getting hammered in a regime where rates increased particularly at the long end of the yield curve.
Equity ETFs covering indices indicate that exposure to SPY as well as the more tech heavy QQQ makes sense. Perhaps counter-intuitively we also see that the best performing GICS ETFs in this regime are Consumer Staples (XLP) and Health Care (XLV).
Two write-ups (which can be found here and here) on quantitative equity factors that work during bear steepeners indicate that investors should increase exposure to high quality value names.
Keep in mind this is an empirical study with a very limited set of data. As such we are not suggesting causality between yield curve regimes and subsequent asset class returns. Do your own analysis and take the results with a grain of salt.
Back