Evaluating the Health of Today's US Treasury Auction
In a previous post we provided a brief primer on some of the mechanics of US Treasury (UST) auctions. We begain with a quick refresher on the basic types of securities (show in Table 1) auctioned and issued by UST.
| Security | Tenors | Description |
|---|---|---|
| Bills | 4 to 52 weeks | sold at a discount and redeemed at par |
| Notes | 2, 3, 5, 7, 10 years | pay a fixed rate of interest 2X per year |
| Bonds | 20, 30 years | pay a fixed rate of interest 2X per year |
| CMB | less than 1 year | cash management bills for short-term financing |
| TIPS | 5, 10, 30 years | pay a fixed rate on a principal indexed to CPI |
| FRN | 2 years | pay a variable rate of interest 4X per year |
Table 1: Securities Auctioned and Issued by the US Treasury
Today's auction will attempt to issue $75B 13-Week (CUSIP 912796CX5) and $68B 26-Week (CUSIP 912797JS7) Bills. For a schedule refer to this link.
The data we consider is the Bid-to-Cover (BTC) ratio which is a statistic that compares the total dollar amount of bids over the dollar amount of bonds sold. A BTC of 1 implies that supply (in the form of the dollar amount UST hopes to raise) was exactly matched by demand (the bids sought by auction participants). Healthier auctions should have BTC as far above 1 as possible.
Figure 1 shows the time-series of BTC for Bills, Notes, and Bonds from 2001 to the present.
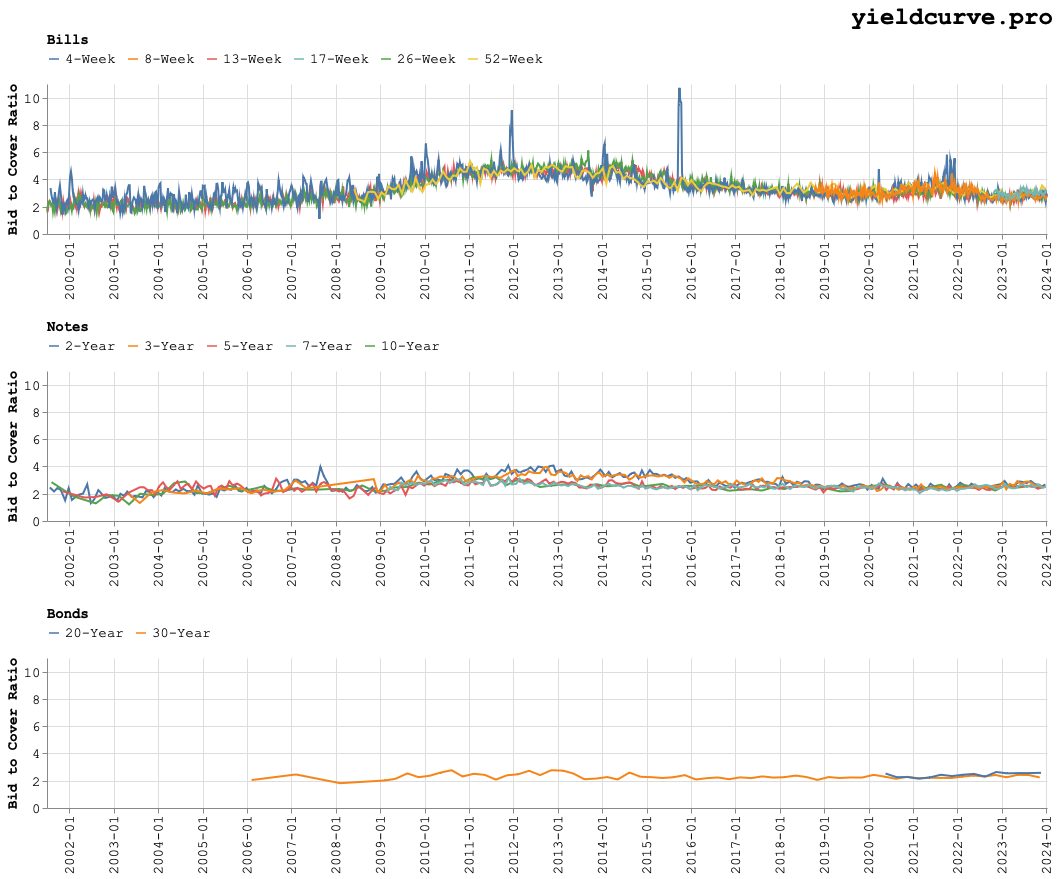
Figure 1: BTC for Bills, Notes, and Bonds: 2001 to the present
Let's examine the distribution density diagram (DDD) for the 2 tenors up for auction today. For the 13- and 26-Week Bills these are shown by Figures 2 and 3.
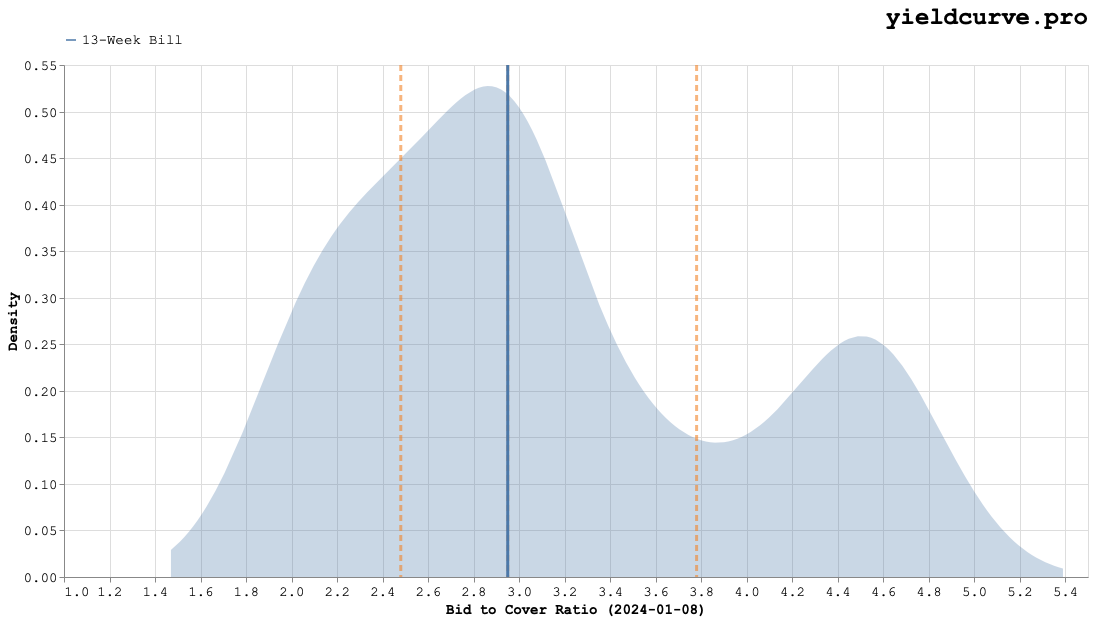
Figure 2: 13-Week Bill BTC Distribution Density Diagram
The mean and interquartile ranges on the DDD are indicated with the vertical orange dashed lines. The left- and right-most lines indicate the 25-th and 75-th percentiles, respectively. The middle line corresponds to the median. The blue line shows the BTC of the most recent auction.
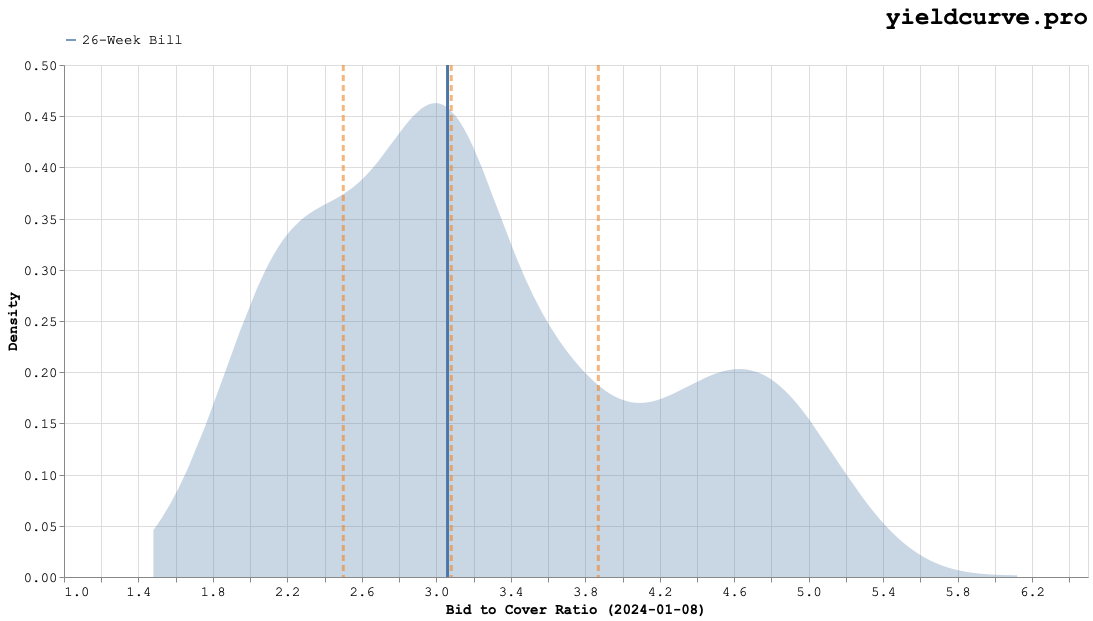
Figure 3: 26-Week Bill BTC Distribution Density Diagram
For both tenors the most recent auctions align closely with historical medians.
Back