A Systematic Approach To Grading US Treasury Auctions
Results from US Treasury auctions are a big deal for the fixed-income market because they show how much people really want to buy and own government debt. When auctions go well, it boosts confidence, potentially leading to more risk taking in capital markets.
To figure out if the auction did well, we can compare the recent auctions to past ones. But which data should we consider? Andy Constan, a Wall Street veteran with decades of experience, has a YouTube video that provides excellent background on the subject and some suggestions on which items to consider.
We can compare Andy's approach to the following ones described by these internet articles:
Data, Scores, and Grades
Borrowing different ideas from each approach and utilizng data provided directly by the US Treasury, we consider the following items:
- Tail - This is the difference between the highest and average yield obtained by auction participants (reported in basis points). It is indicative of whether or not all buyers paid a similar price or did some get bonds on the cheap. A small tail relative to history is considered better.
- Bid-to-Cover - This measures the total amount of bids received for a given auction divided by the amount actually sold. Higher relative to history is better.
- Indirect - This is the percentage of non-competitive bidders (typically foreigners) placing bids through a primary dealer. They participate this way because they are often unable or unwilling to do so directly. Higher relative to history is better.
- Direct - The is the percentage of institutions who are placing bids on the auction directly with the US Treasury. Higher relative to history is better.
We will take each individual data item and create a score based on its time series. The first step is to construct a z-score for each factor using an expanding window.
$$z_{it} = \frac{f_{it} - \mu_{it}}{\sigma_{it}}$$ where $$f_{it} := i\text{-th factor at time t}$$ $$\mu_{it} := \text{expanding window ave from time 0 to t}$$ $$\sigma_{it} := \text{expanding window std from time 0 to t}$$
Next, we use the cumulative distribution function to transform the z-score to a score between 0 and 1.
$$s_{it} = CDF\left(z_{it}\right) \; \epsilon \; \left[0,1\right]$$
Then we equally weight the factors to arrive at an overall composite score.
$$S_{t} = \frac{1}{N}\sum\limits_{i=1}^{N}s_{it}$$
Last, we map a given factor or composite score to a letter grade via the following table:
| Score Interval | Letter Grade |
|---|---|
| (0.0, 0.1] | D- |
| (0.1, 0.2] | D |
| (0.2, 0.3] | D+ |
| (0.3, 0.4] | C- |
| (0.4, 0.5] | C |
| (0.5, 0.6] | C+ |
| (0.6, 0.7] | B- |
| (0.7, 0.8] | B |
| (0.8, 0.9] | B+ |
| (0.9, 1.0] | A |
Table 1: Mapping Scores In The Unit Interval To A Letter Grade
A score of 0 would result in a letter grade of F. This corresponds to an auction failing and is a situation the US Treasury has never experienced.
The four factors above can be easily computed using data made available by the US Treasury. This website hosts a simple app compiling these data, constructing the individual and composite scores, and presenting their charts via a simple interface. Instructions on how to use the app can be found here.
Examples of Recent Auctions
Figures 1 through 4 show charts for each of the above data items. The auction is for a recent 13-Week Bill issuance where Treasury raised $67B with an averagea yield of 5.24%.
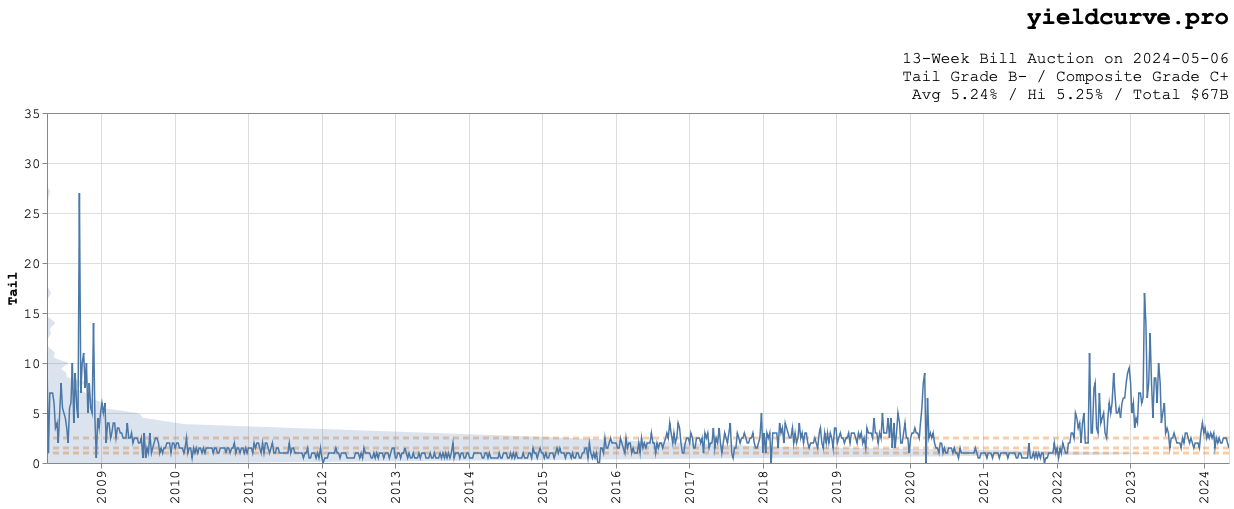
Figure 1: Tail Auction Data From April 2008 to May 2024
Based on the Tail data for the entire time period, this auction received a B-.
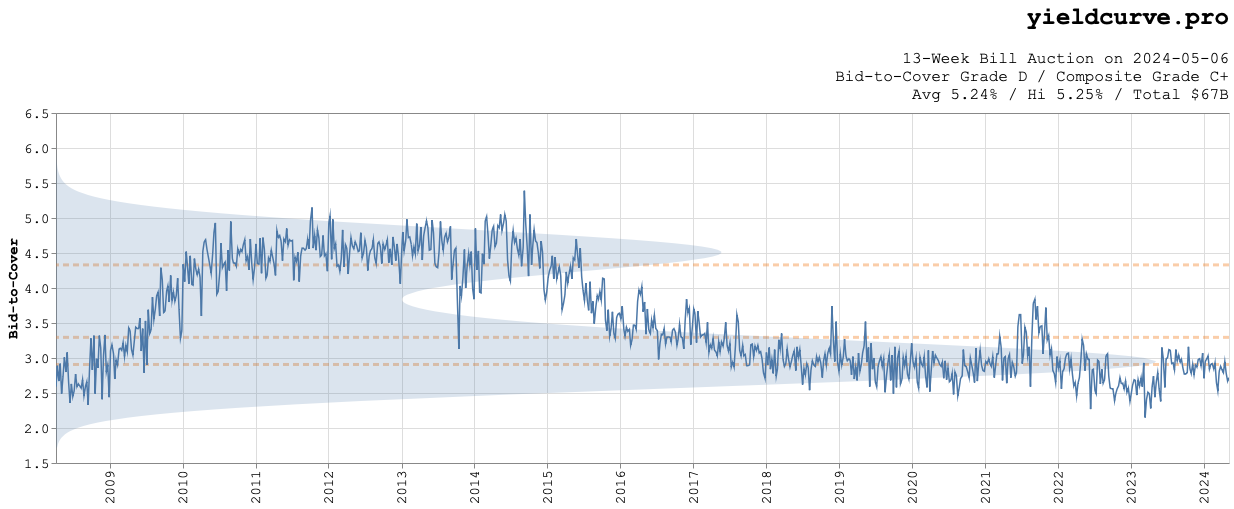
Figure 2: Bid-to-Cover Auction Data From April 2008 to May 2024
Bid-to-cover data fell well below average and earned a D.
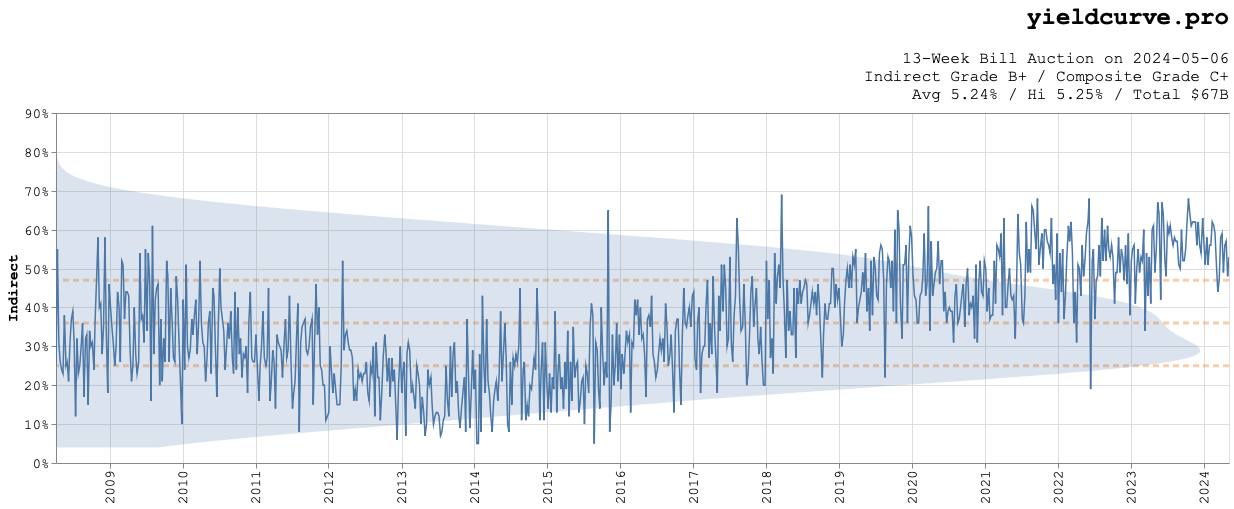
Figure 3: Indirect Auction Data From April 2008 to May 2024
Indirect ended the period above average and received a B+.
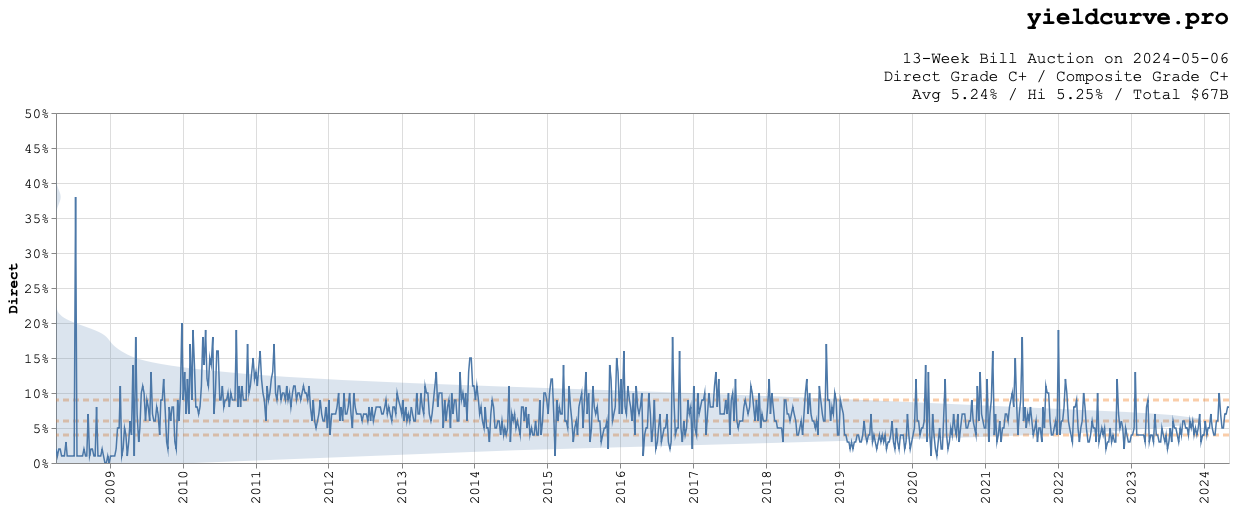
Figure 4: Direct Auction Data From April 2008 to May 2024
The Direct time-series ended the period more or less average and received a C+. Equally weighting each grade, we end up with a composite grade of C+, as well.
Conclusion
The grades assigned to each auction are strongly dependent on the start and end dates chosen for the analysis. If we care more about short term data decrease the amount of time between the two. Feel free to experiment with the app and feel free to send us feedback.
Back