What do current market movements in stocks and bonds have to say about 60/40 fund weights?
This is the October 2024 installment of a series of posts we make to track how the weights of a synthetic 60/40 stock/bond portfolio evolve intra-month.
Each month we coduct a simple experiment: track the cumulative intra-month return of two stock/bond indices (say SPY and TLT). Next, combine that data to estimate a one standard deviation envelope of weights as a function of the days in the month. Then measure where the current weights sit within the envelope. This provides a measure of how much a typical 60/40 fund needs to move in order to restore equilibrium.
Figure 1 depicts the envelopes and current weights for SPY and TLT.
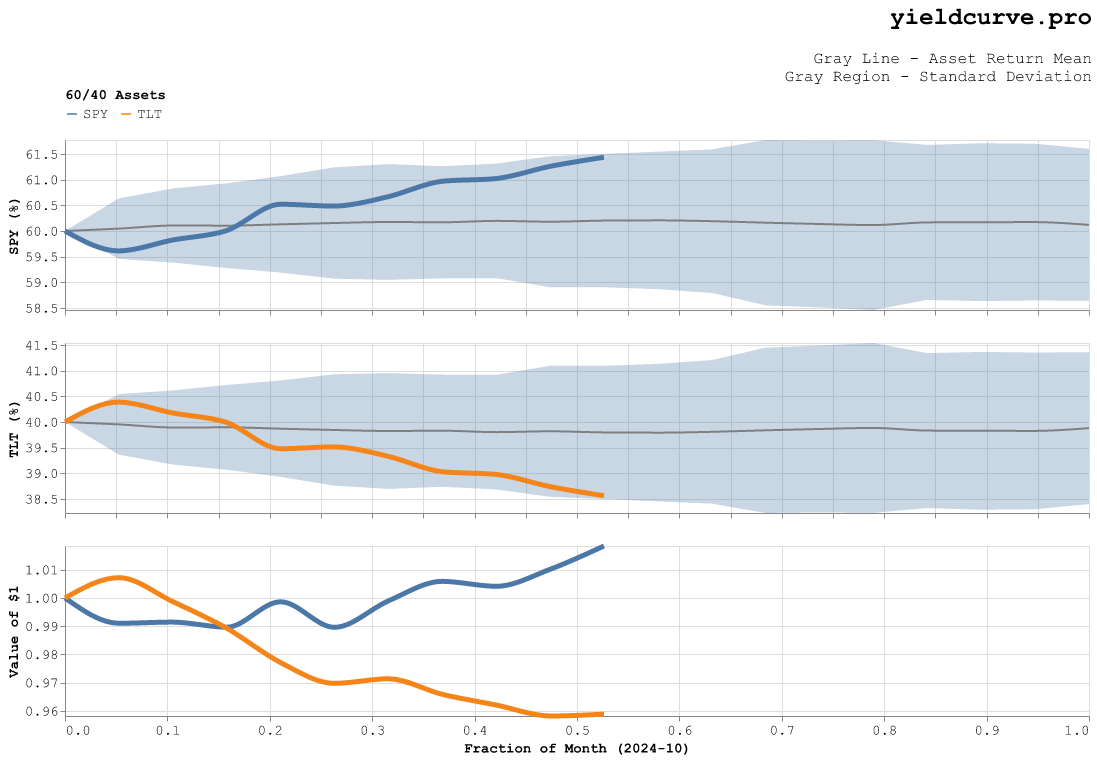
Figure 1: Stock/Bond Weights For October 2024
On an absolute basis, stocks have out performed bonds by about 600 basis points. Let's take a look at the stock-bond weightings month-to-date on a relative 60-40 basis.
Stocks are about 125 basis points above average (the thick grey line) at this point in the month based on historical data. Based on symmetry this means that bonds are about 125 basis points below average. Assuming these positions are maintained until the end of the month, this means that 60/40 funds will be net sellers of stocks and buyers of bonds in order to restore equilibrium.
See you next month.
Cheers -- YCP
Back