Examining Yield Curve Similarity (Part 2)
Recap
Last time (Part 1) we discussed a naive way of measuring similarity in yield curves at two distinct points in time. Then, by association, we should be able to identify similar interest rate environments. At least that's the simple logic.
Our conclusion was that, while the simple distance or (dis)similarity metric worked as intended, identifying yield curves with the same shape (level and slope) was insufficient. In addition to these we need to incorporate some sense of path dependency or "how did the yield curves come to be in those configurations?" If two curves have similar level and slope and attained those by traveling similar paths then perhaps we can say the interest rate environments have something in common as well.
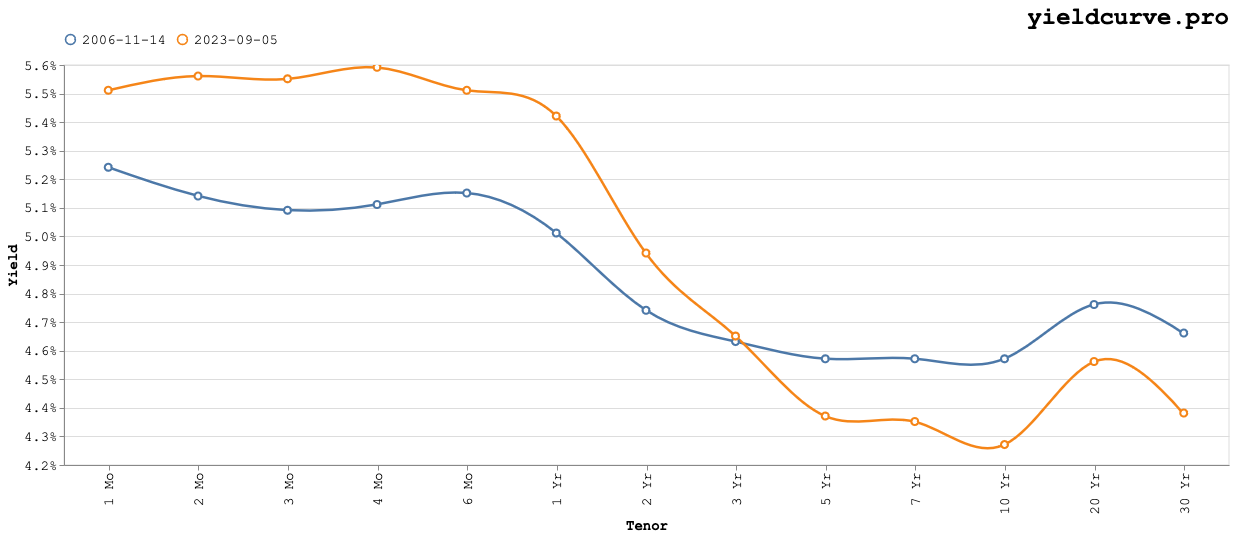
Let's revisit our basic conclusion from last time. Namely that, using the last 20 years or so of yield curve data, the yield curve most similar to September 5, 2023 occurred on November 14, 2006. This result was due to our Manhattan Distance metric which we confirmed visually with a side-by-side comparison.
Components
Performing a Principal Component Analysis (PCA) on the time-series of yield curve data allows us to quantitatively measure the level and slope over time.
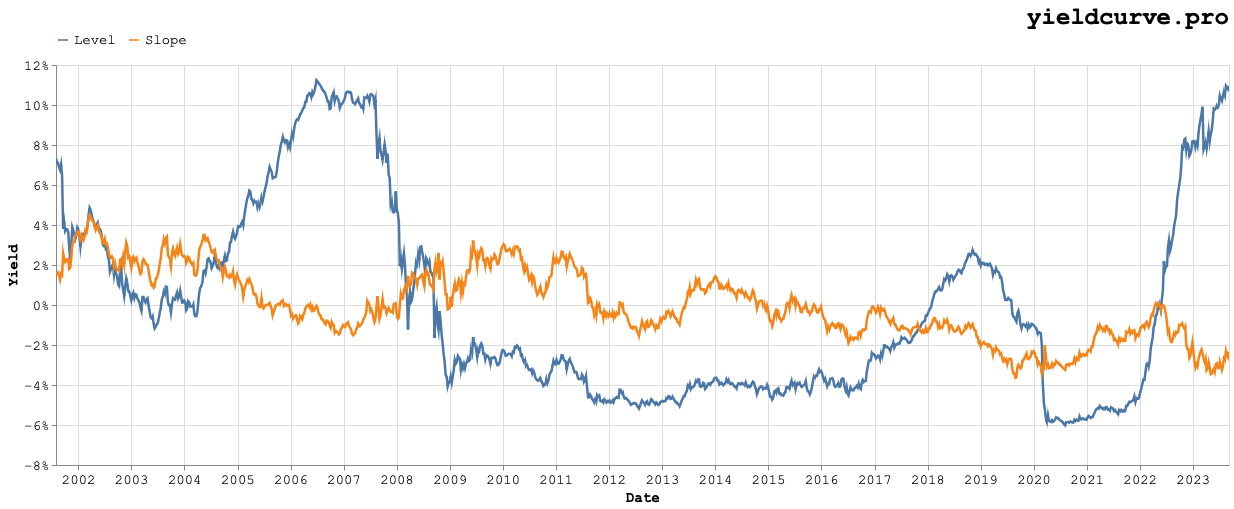
The level and slope for September 5, 2023 was approximately 4.3% and -1.3%, respectively. On November 14, 2006 they were 4.6% and -0.5%. So far, so good. But is this enough?
Notice that in the periods leading up to each date, level and slope travel distinct paths. Leading up to November 2006 level is flat to slightly decreasing while leading up to September 2023 it is strongly increasing. Also, slope leading up to November 2006 is decreasing while leading up to September 2023 it increasing.
Bears, Bulls, Steepeners, Flatteners, Oh My!
Using the concepts discussed in Thoughts On Bear, Bull, Flatteners, Steepeners we characterize November 2006 and September 2023 as Bull Flattener and Bear Steepener, respectively.
Recall that a bear flattener refers to a shift in the yield curve where the difference between short-term and long-term rates narrows. This can occur when long-term rates rise, but short-term rates rise even more. It may suggest tightening monetary policy by the Federal Reserve. Investors might interpret it as a sign of potential economic slowdown.
Also, a bear steepener refers to a shift in the yield curve where the spread between short-term and long-term interest rates widens. This often occurs when long-term rates rise more significantly than short-term rates. It can signal expectations of higher inflation or interest rate hikes in the future. Investors might anticipate economic growth and potentially seek higher yields from longer-term investments.
Conclusion
How should we interpret this? For starters, it would suggest that, with respect to interest rate environments, November 2006 and September 2023 have important differences (by the way this tool can help identify the regime as a function of date)
Coming full circle, we can revisit something we considered in Part 1. How do these different interest rate regimes affect return streams for different assets? More precisely, what types of assets perform best in the four different bear, bull, flattener, steepener regimes?
This is something we will consider in a subsequent post.
Back