The Yield Curve Predicted a Recession That Never Came — What Went Wrong?
The yield curve inverted in 2022. By historical standards, a recession should have followed within 12 to 24 months. It didn't.
This is uncomfortable for anyone who takes the yield curve seriously. The 10 Yr - 3 Mo — the 10 Yr Treasury yield minus the 3 Mo T-bill yield — had predicted every U.S. recession since the 1960s without a single false signal in eight cycles. In 2022 it inverted to nearly -200 bp and held there for two years. And yet here we are in early 2026, with GDP growth still positive and unemployment at 4.3%. The indicator didn't just miss. It missed by a mile.
The signal and its author
In 1986, Campbell Harvey — then a PhD candidate at the University of Chicago under Eugene Fama — published research linking yield curve inversions to economic growth. His preferred spread in subsequent work and public commentary has been the 10 Yr - 3 Mo: the 10 Yr Treasury yield minus the 3 Mo T-bill yield. That measure carries an 8 for 8 track record preceding U.S. recessions since the 1960s, with no false signals prior to 2022.
The spread the financial press fixates on is the 10 Yr - 2 Yr. That is not Harvey's indicator. Harvey has said so repeatedly, and for good reason: the 10 Yr - 2 Yr gave a false signal in 1998, inverting briefly without a recession following. It is a reasonable proxy but a noisier one, and conflating the two has caused no end of confusion in the current episode.
Both measures inverted in 2022. Using our data, we examined how each episode since 2001 played out and why this one didn't follow the script.
The track record since 2001
The slopes chart shows the 10 Yr - 2 Yr from 2001 through today, with three prior inversion episodes visible. In each, the pattern is clean: inversion, persistence, un-inversion, recession. Table 1 maps the timing.
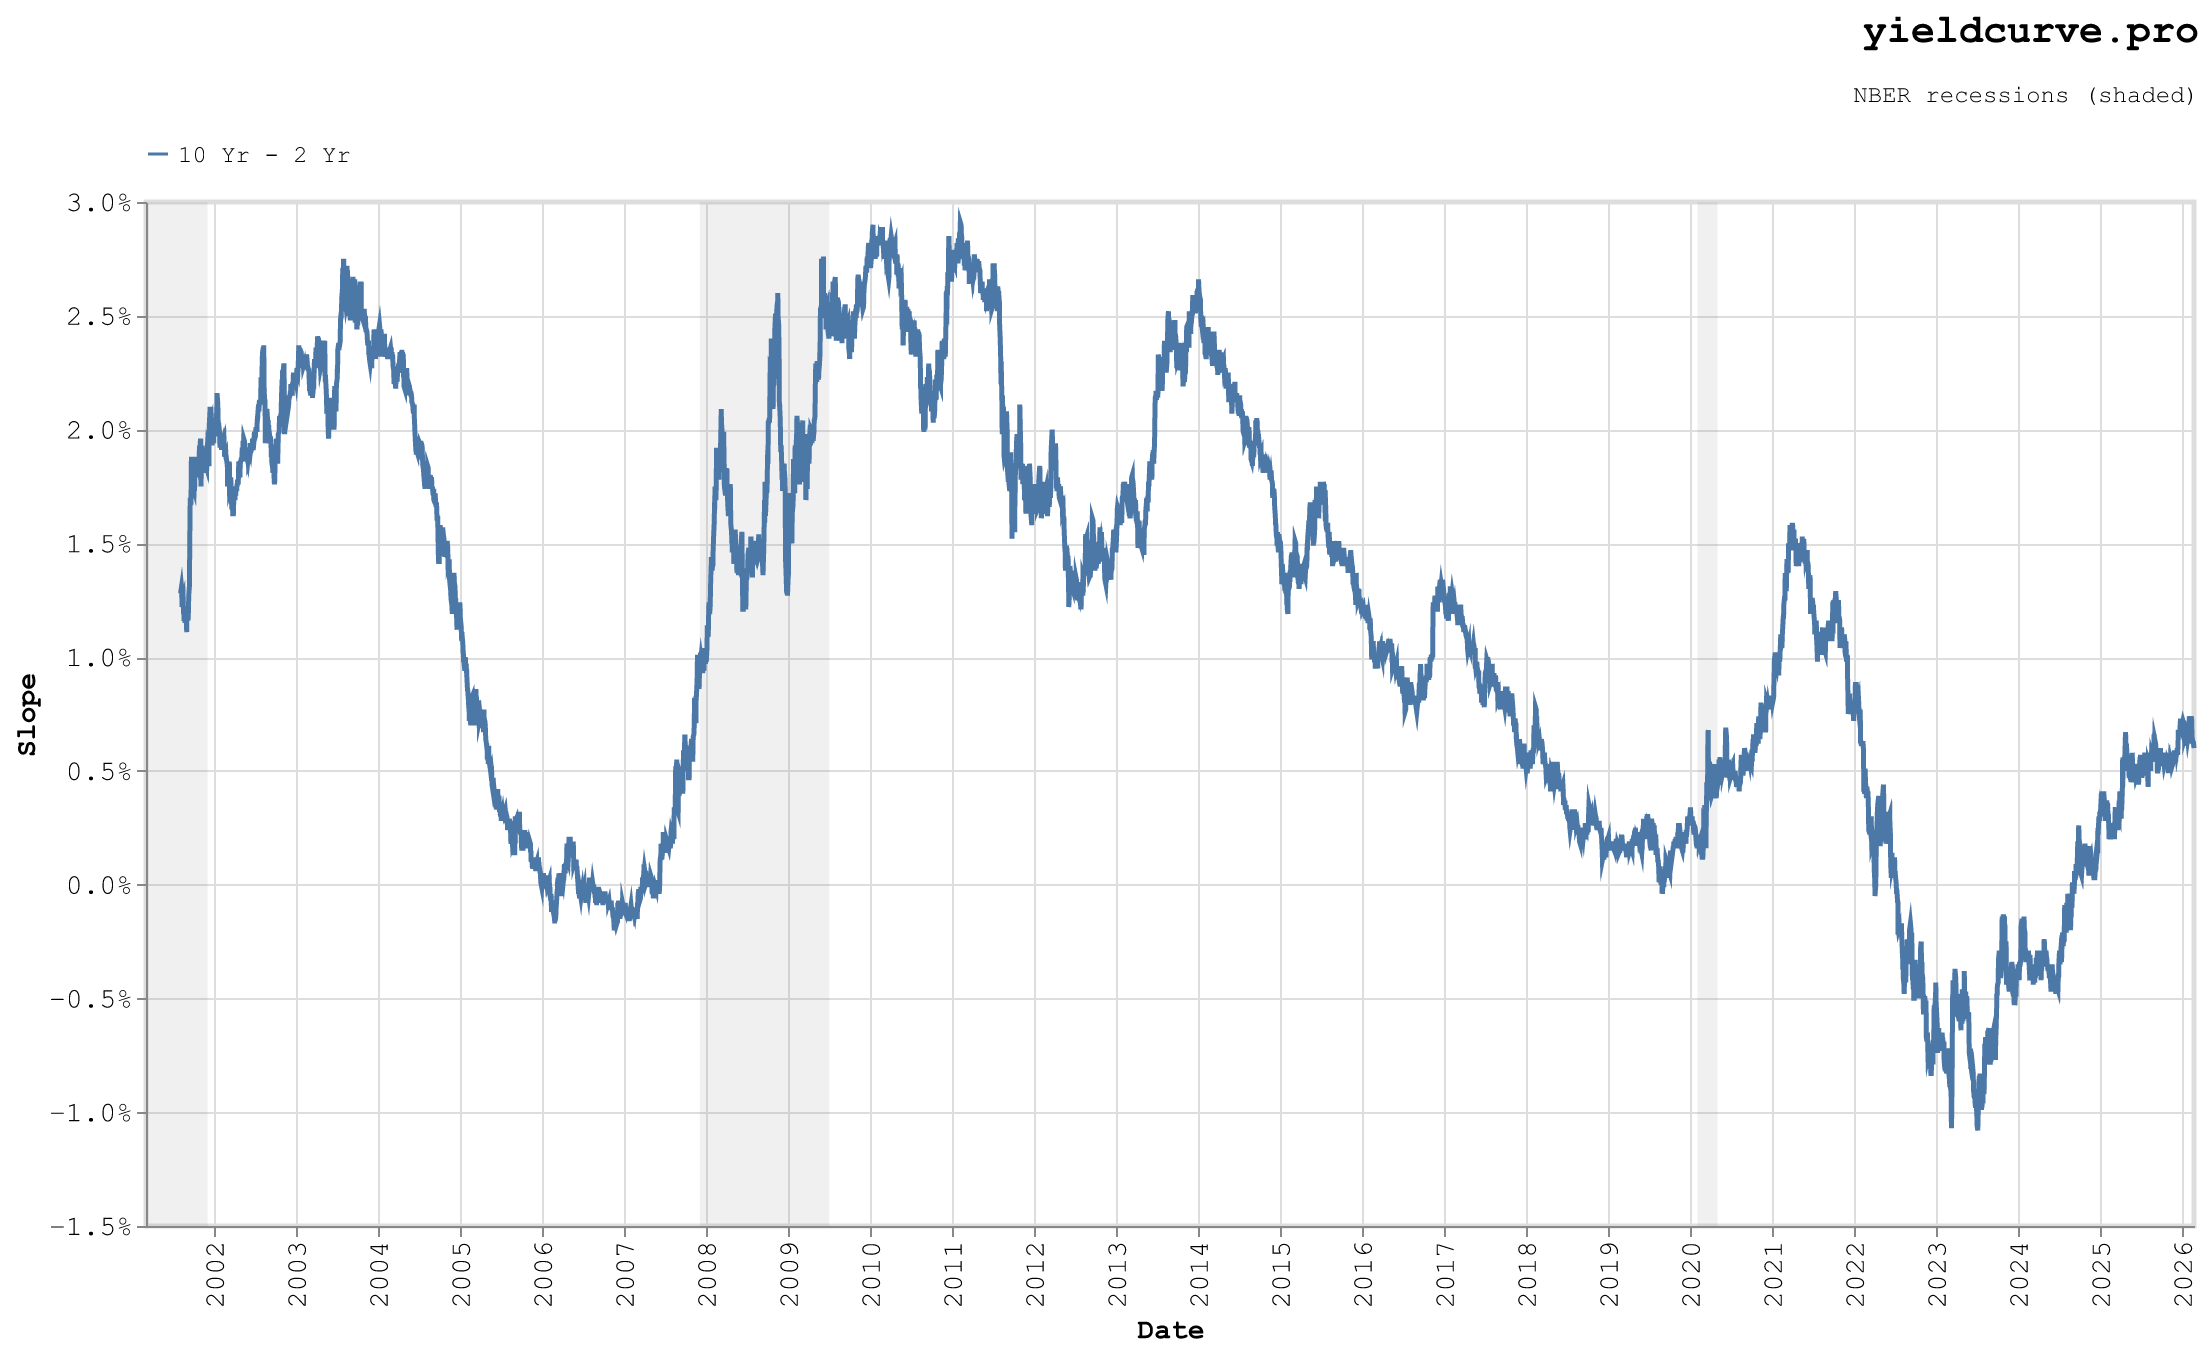
Figure 1: 10 Yr - 2 Yr Spread (2001–Present) With Recession Periods
| Episode | Inversion Start | Recession Start | Lead Time | Max Inversion |
|---|---|---|---|---|
| 2001 | pre-20011 | Mar 2001 | — | ≤ -30 bp2 |
| 2007–09 | Jun 2006 | Dec 2007 | 18 Mo | -30 bp |
| 2020 | Aug 2019 | Feb 2020 | 6 Mo | -60 bp |
| 2022– | Apr 20223 | — | 43+ Mo | -100 bp |
Table 1: 10 Yr - 2 Yr Inversions and Subsequent Recessions
The 2022 episode was the deepest inversion in the dataset by a wide margin — at least three times the observed depth of both 2001 and 2007, and roughly two-thirds deeper than the 2020 trough. We are now past 43 months since the April 2022 inversion, well beyond the longest lead time in this data. The curve has un-inverted and steepened. The window has closed.
Two spreads, one miss
Figure 2 shows the 10 Yr - 2 Yr and 10 Yr - 3 Mo together.
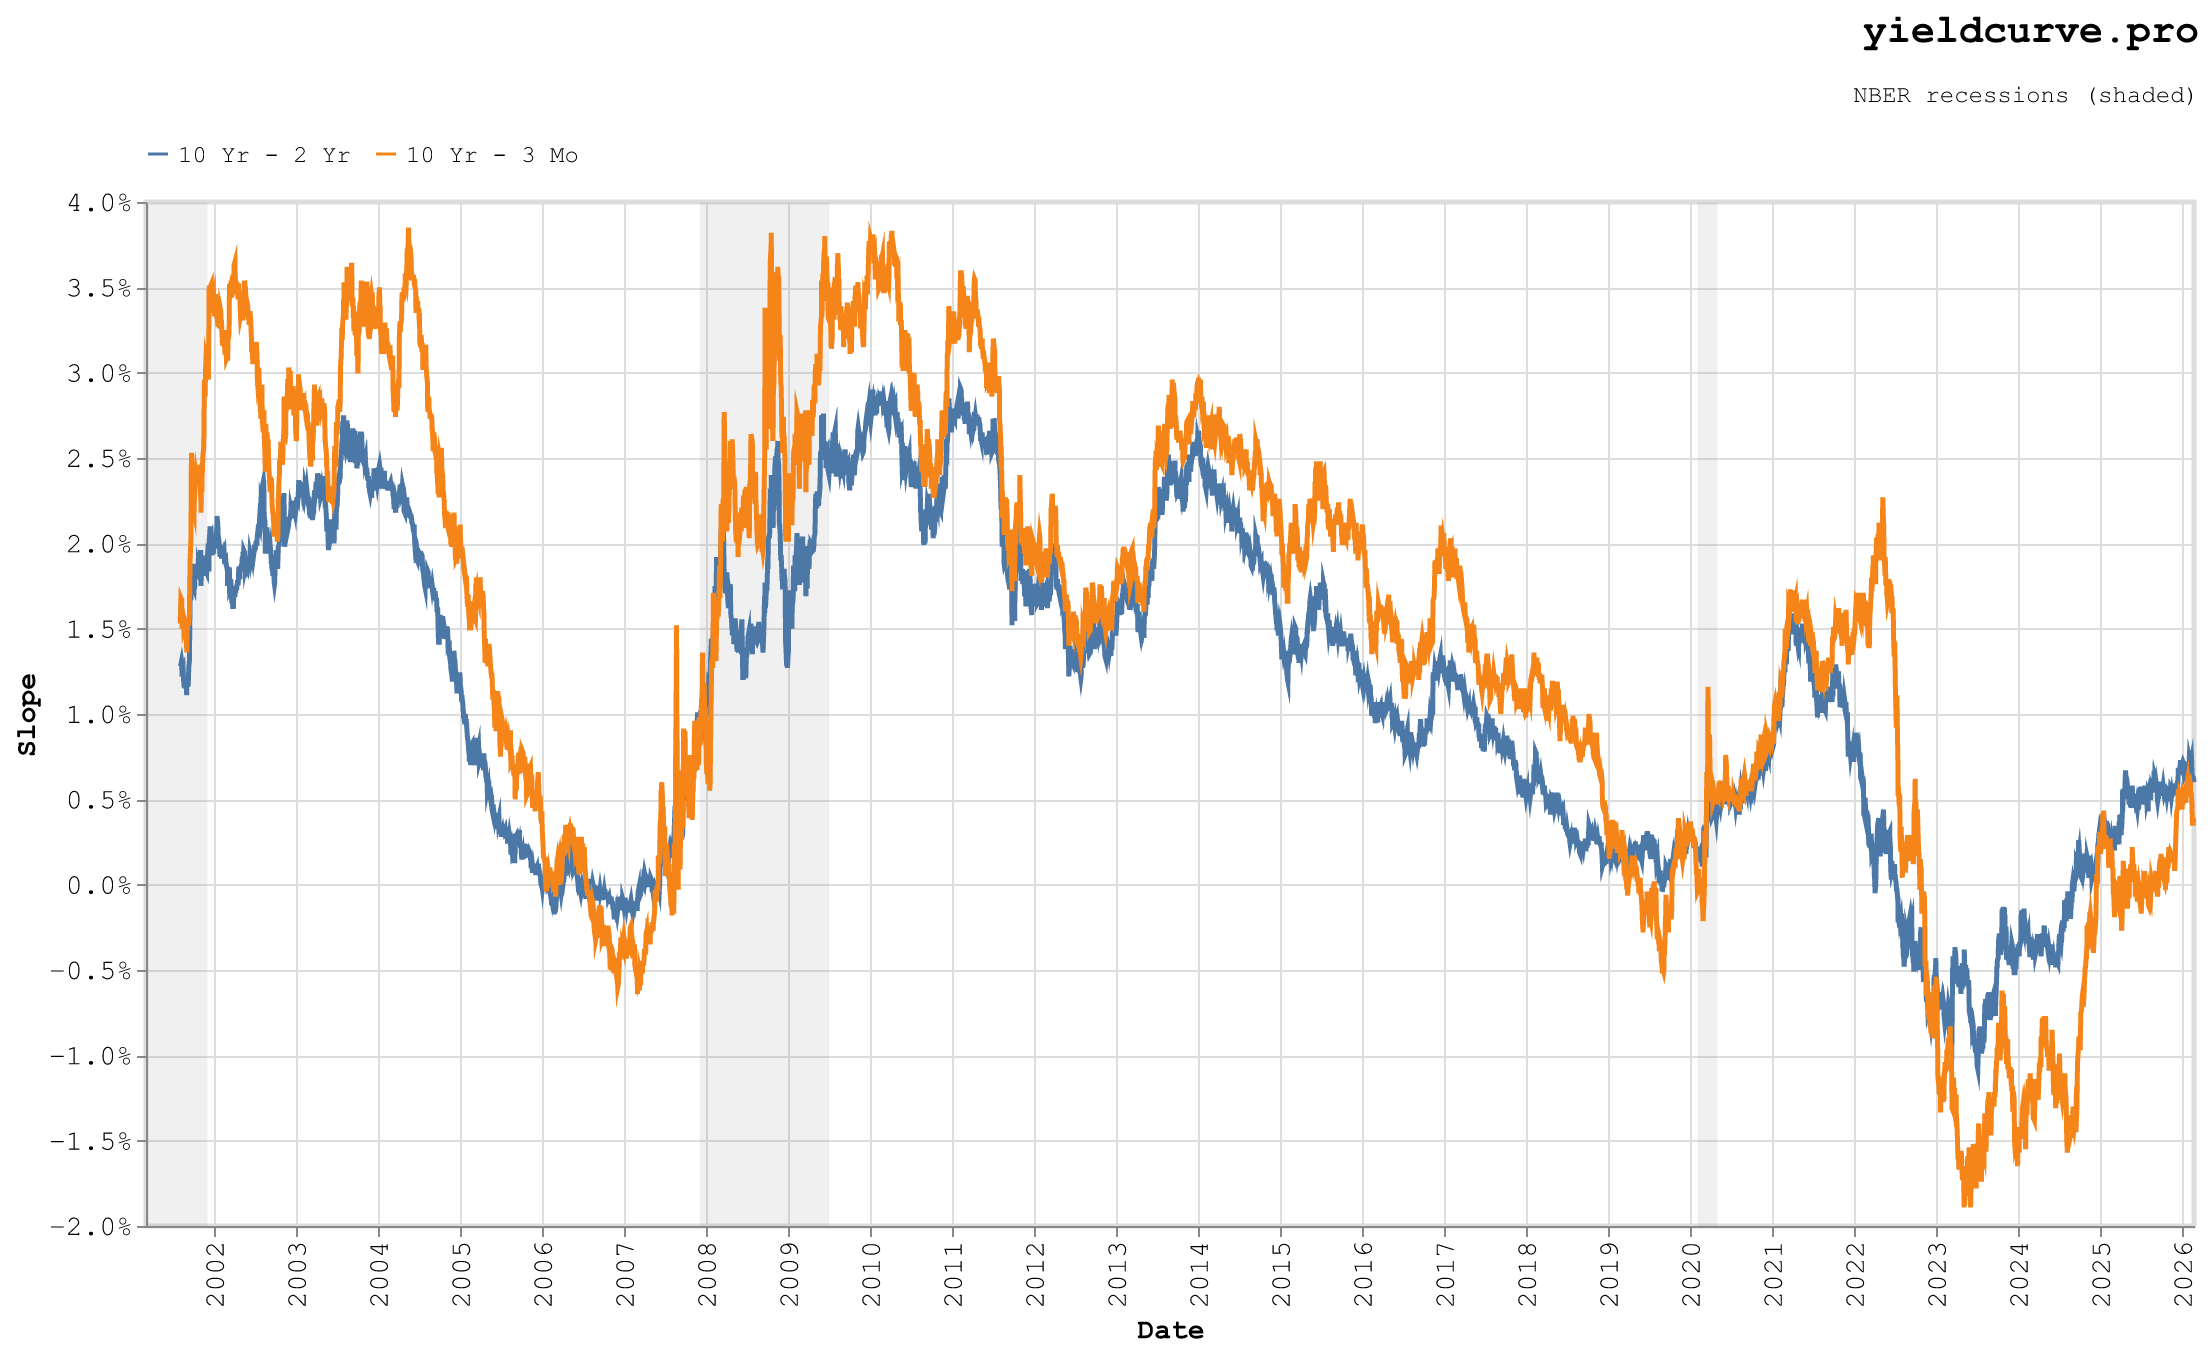
Figure 2: 10 Yr - 2 Yr vs. 10 Yr - 3 Mo Spread (2001–Present)
The 10 Yr - 2 Yr crossed zero first, in April 2022. The 10 Yr - 3 Mo followed in October 2022 as the Fed pushed the funds rate above 5% while the long end refused to follow. The 10 Yr - 3 Mo ultimately reached nearly -200 bp — roughly double the 10 Yr - 2 Yr depth. Both have now un-inverted.
The depth of the 10 Yr - 3 Mo inversion matters. This was not a marginal, ambiguous signal. Harvey's indicator — the one with the unblemished track record — fired more emphatically in 2022 than in any prior cycle in this dataset. And it was still wrong.
Harvey himself called it early. In 2023, while the 10 Yr - 3 Mo was still deeply inverted, he said publicly he believed it was likely a false signal. His reasoning: the real yield curve — inflation-adjusted — was far less inverted than the nominal, suggesting the inversion was driven more by elevated inflation expectations than by genuine pessimism about future growth. He also noted that the signal had become so widely followed that it may have altered the behavior it was meant to predict — businesses and consumers bracing for recession and adjusting in ways that ultimately helped avoid one.
Not your father's recession setup
Figure 3 shows today's curve against the curves at the onset of the 2007–09 and 2020 recessions. The visual makes the argument better than words can.
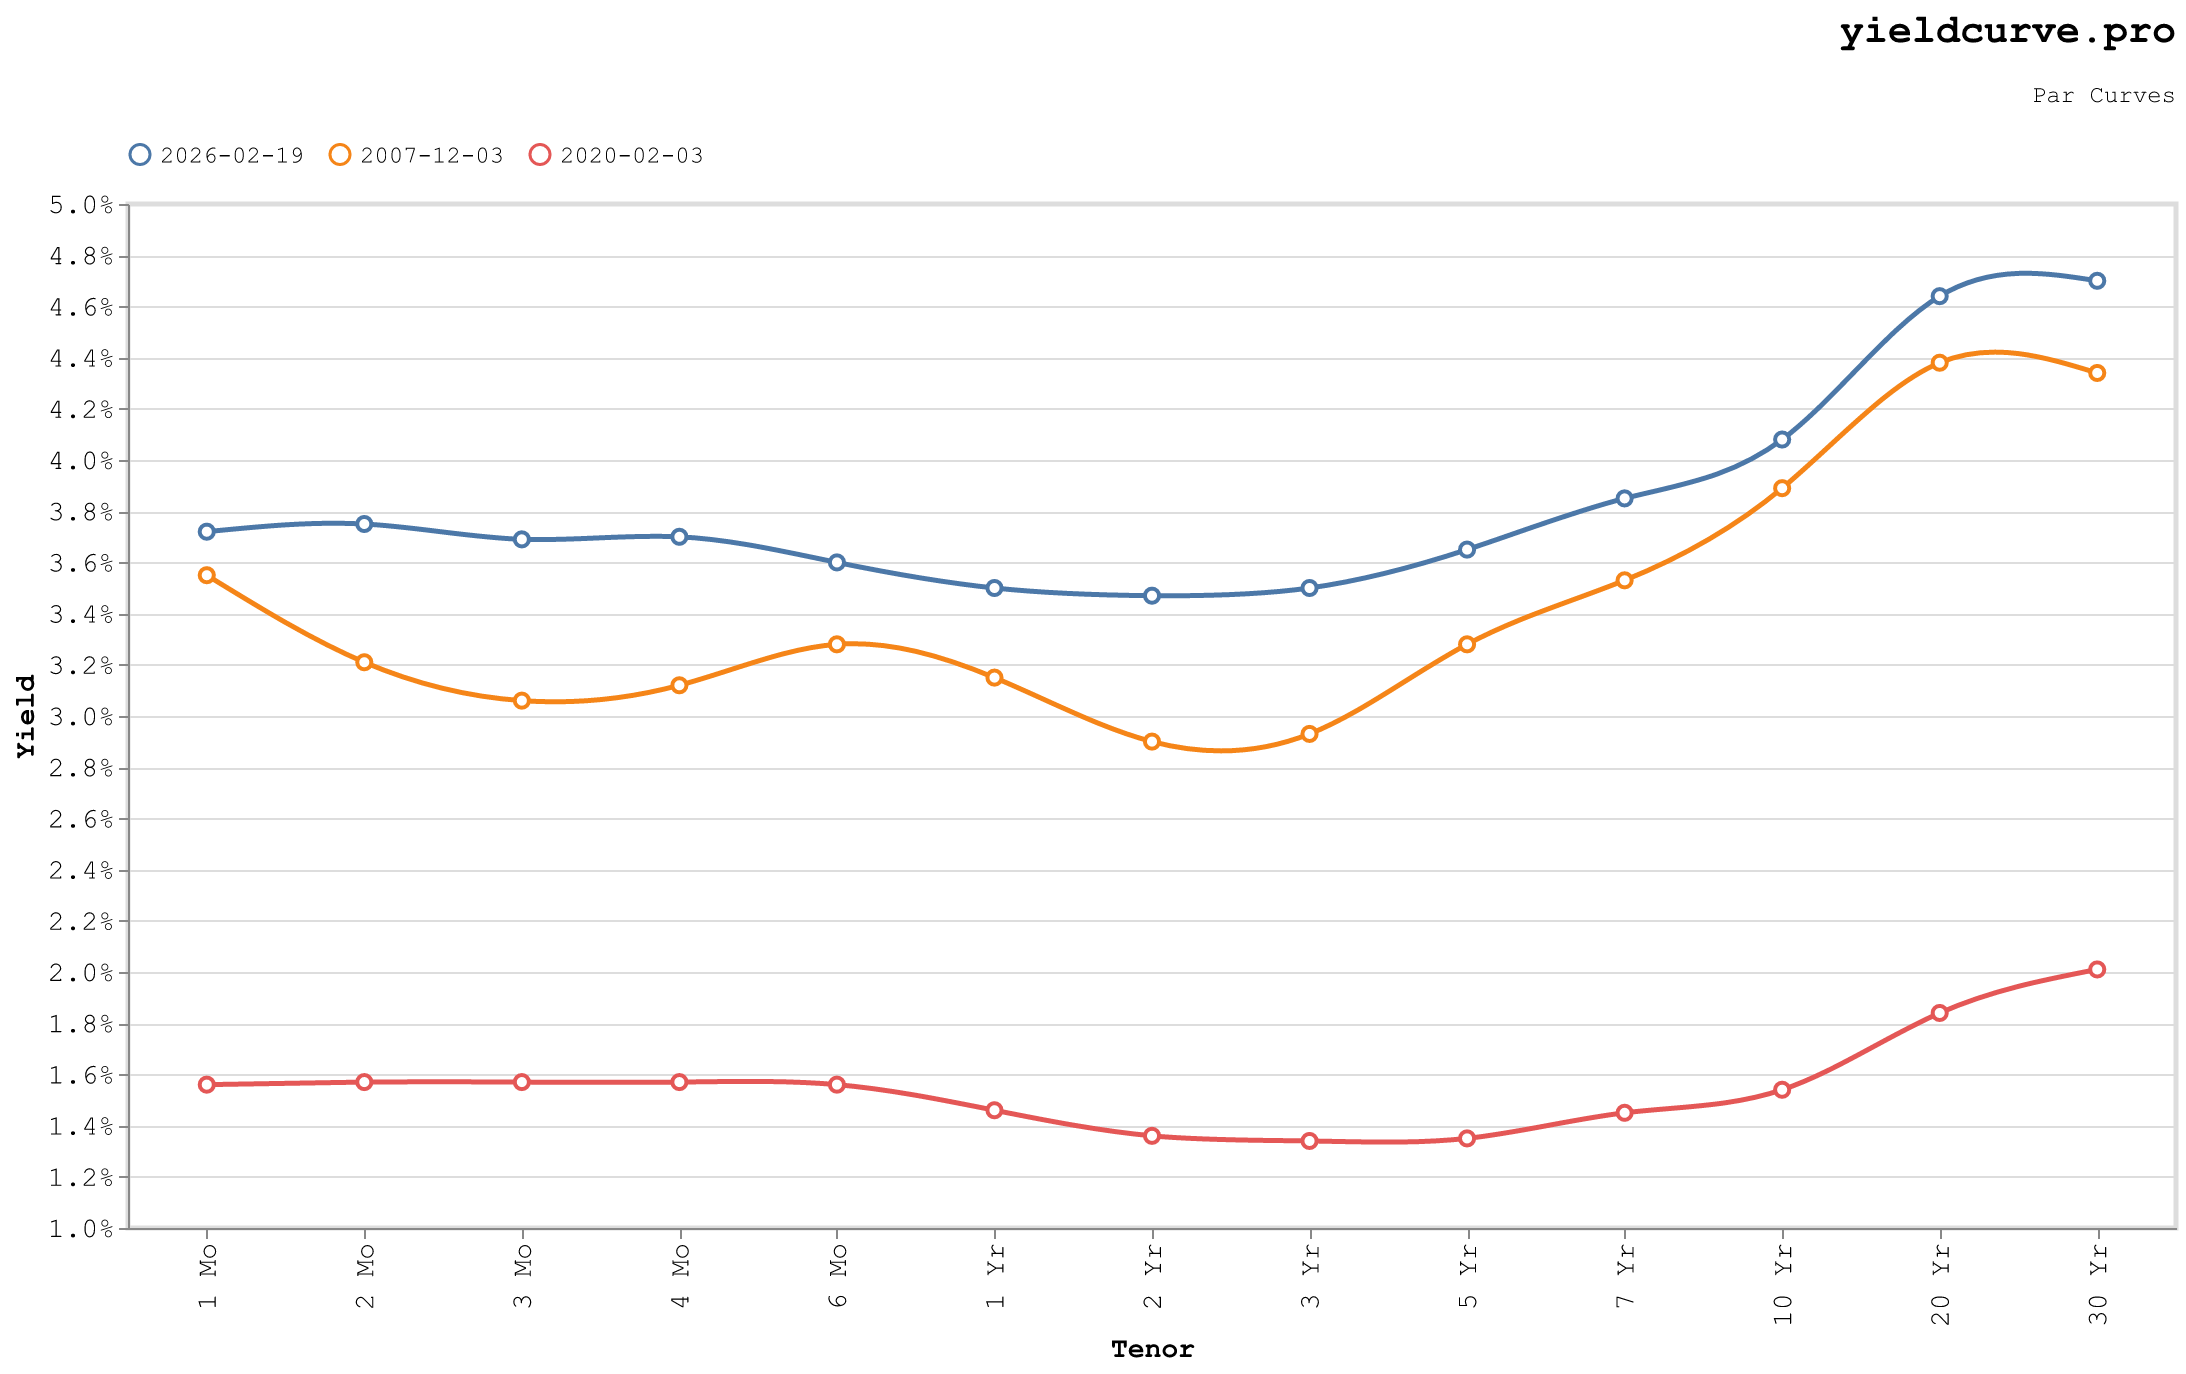
Figure 3: Today's Curve vs. Prior Recession-Onset Curves
December 2007: a wavy, distorted curve already pricing aggressive Fed cuts, with the 2–3 Yr belly collapsing below 3% while the front end stayed elevated. February 2020: a pancake-flat line pinned at 1.6% from 1 Mo to 10 Yr, zero slope, zero term premium, a market priced for stagnation. Today: steep, upward-sloping, sitting roughly 200 bp above the 2020 curve in absolute level, with the long end approaching 4.75%. These are not variations on a theme. They are different instruments entirely.
What overwhelmed the signal
The yield curve works as a recession indicator through a specific causal chain: the Fed tightens, short rates exceed long rates, bank lending margins compress, credit contracts, growth slows. The curve is a proxy for that mechanism — useful precisely because it summarizes the transmission of monetary policy into the real economy. In 2022–2025, four forces hit that chain simultaneously.
Excess household savings. Roughly $2 trillion in pandemic-era savings accumulated in 2020–2021. Consumers kept spending through the tightening cycle, blunting the demand destruction that normally follows rate hikes. By the time those savings were exhausted, labor income had stepped in as the sustaining force.
Fiscal dominance. Federal deficits exceeded 6% of GDP in both FY2023 and FY2024. Outside of wartime or recession, that is without modern precedent. The Treasury was injecting demand into the economy at the same rate the Fed was trying to drain it. Monetary policy was not operating in a vacuum — it was fighting a fiscal expansion of unusual size.
Labor supply. Immigration from 2022 to 2024 expanded the labor force and relieved wage pressure without requiring job destruction. Prior disinflation cycles forced the Fed to break the labor market to break inflation. This time, supply came to the Fed's rescue. The unemployment rate barely moved.
Term premium and QT noise. Quantitative tightening — the Fed shrinking its balance sheet — increased net duration supply to private markets, pushing long yields higher than they would otherwise have been. This elevated the long end for supply reasons rather than growth expectations, suppressing the apparent depth of inversion: the 10 Yr - 3 Mo looked less recessionary than a pure expectations read would imply. That the spread still reached nearly -200 bp despite this upward pressure on the long end underscores how forcefully the front end was being driven by the Fed. The regimes chart tells this story well. The 2022–2023 period was predominantly Bear Flattener — both yields rising, short end leading, spread compressing toward inversion. By late 2024, the regime rotated to Bull Steepener — the Fed cutting while the long end held on term premium. That is the sequence you get after a soft landing, not a recession.
Is the signal broken?
BMO published a note in September 2024 calling this a "false positive" and questioning whether the yield curve retains predictive value. They are right to ask — but the more precise answer is that the signal was overwhelmed, not broken.
Harvey's 10 Yr - 3 Mo fired at nearly -200 bp and held there for two years. It was not a marginal reading. The transmission mechanism simply met forces it had never encountered at this scale in combination: a consumer backstopped by $2 trillion in savings, a government running 6% deficits during a tightening cycle, a labor market replenished by immigration, and a long end elevated by QT-driven term premium. Remove any one of those and the recession probably arrives. Stack all four and the curve cries wolf.
The indicator is not broken. The conditions under which it works reliably have changed. Fiscal deficits show no sign of normalizing. Term premium remains structurally elevated. If the curve inverts again — and at some point it will — the question is not whether the 10 Yr - 3 Mo is flashing red. The question is what else is in the room.
What the curve is pricing now
The 10 Yr - 2 Yr stands at +65 bp and the 10 Yr - 3 Mo at +40 bp as of mid-February 2026. The slopes chart shows both spreads comfortably positive and widening. The inversion is not a recent memory — it ended over a year ago.
The forward curve fills in the details. The 1-year forward sits roughly 30 bp below spot at the front end — the market is pricing one or two additional Fed cuts over the next year, nothing dramatic. At the long end, the forward curve sits above spot, with the implied 10 Yr yield in one year around 4.30% against a spot of 4.13%. The long end is not rallying. Term premium is sticky.
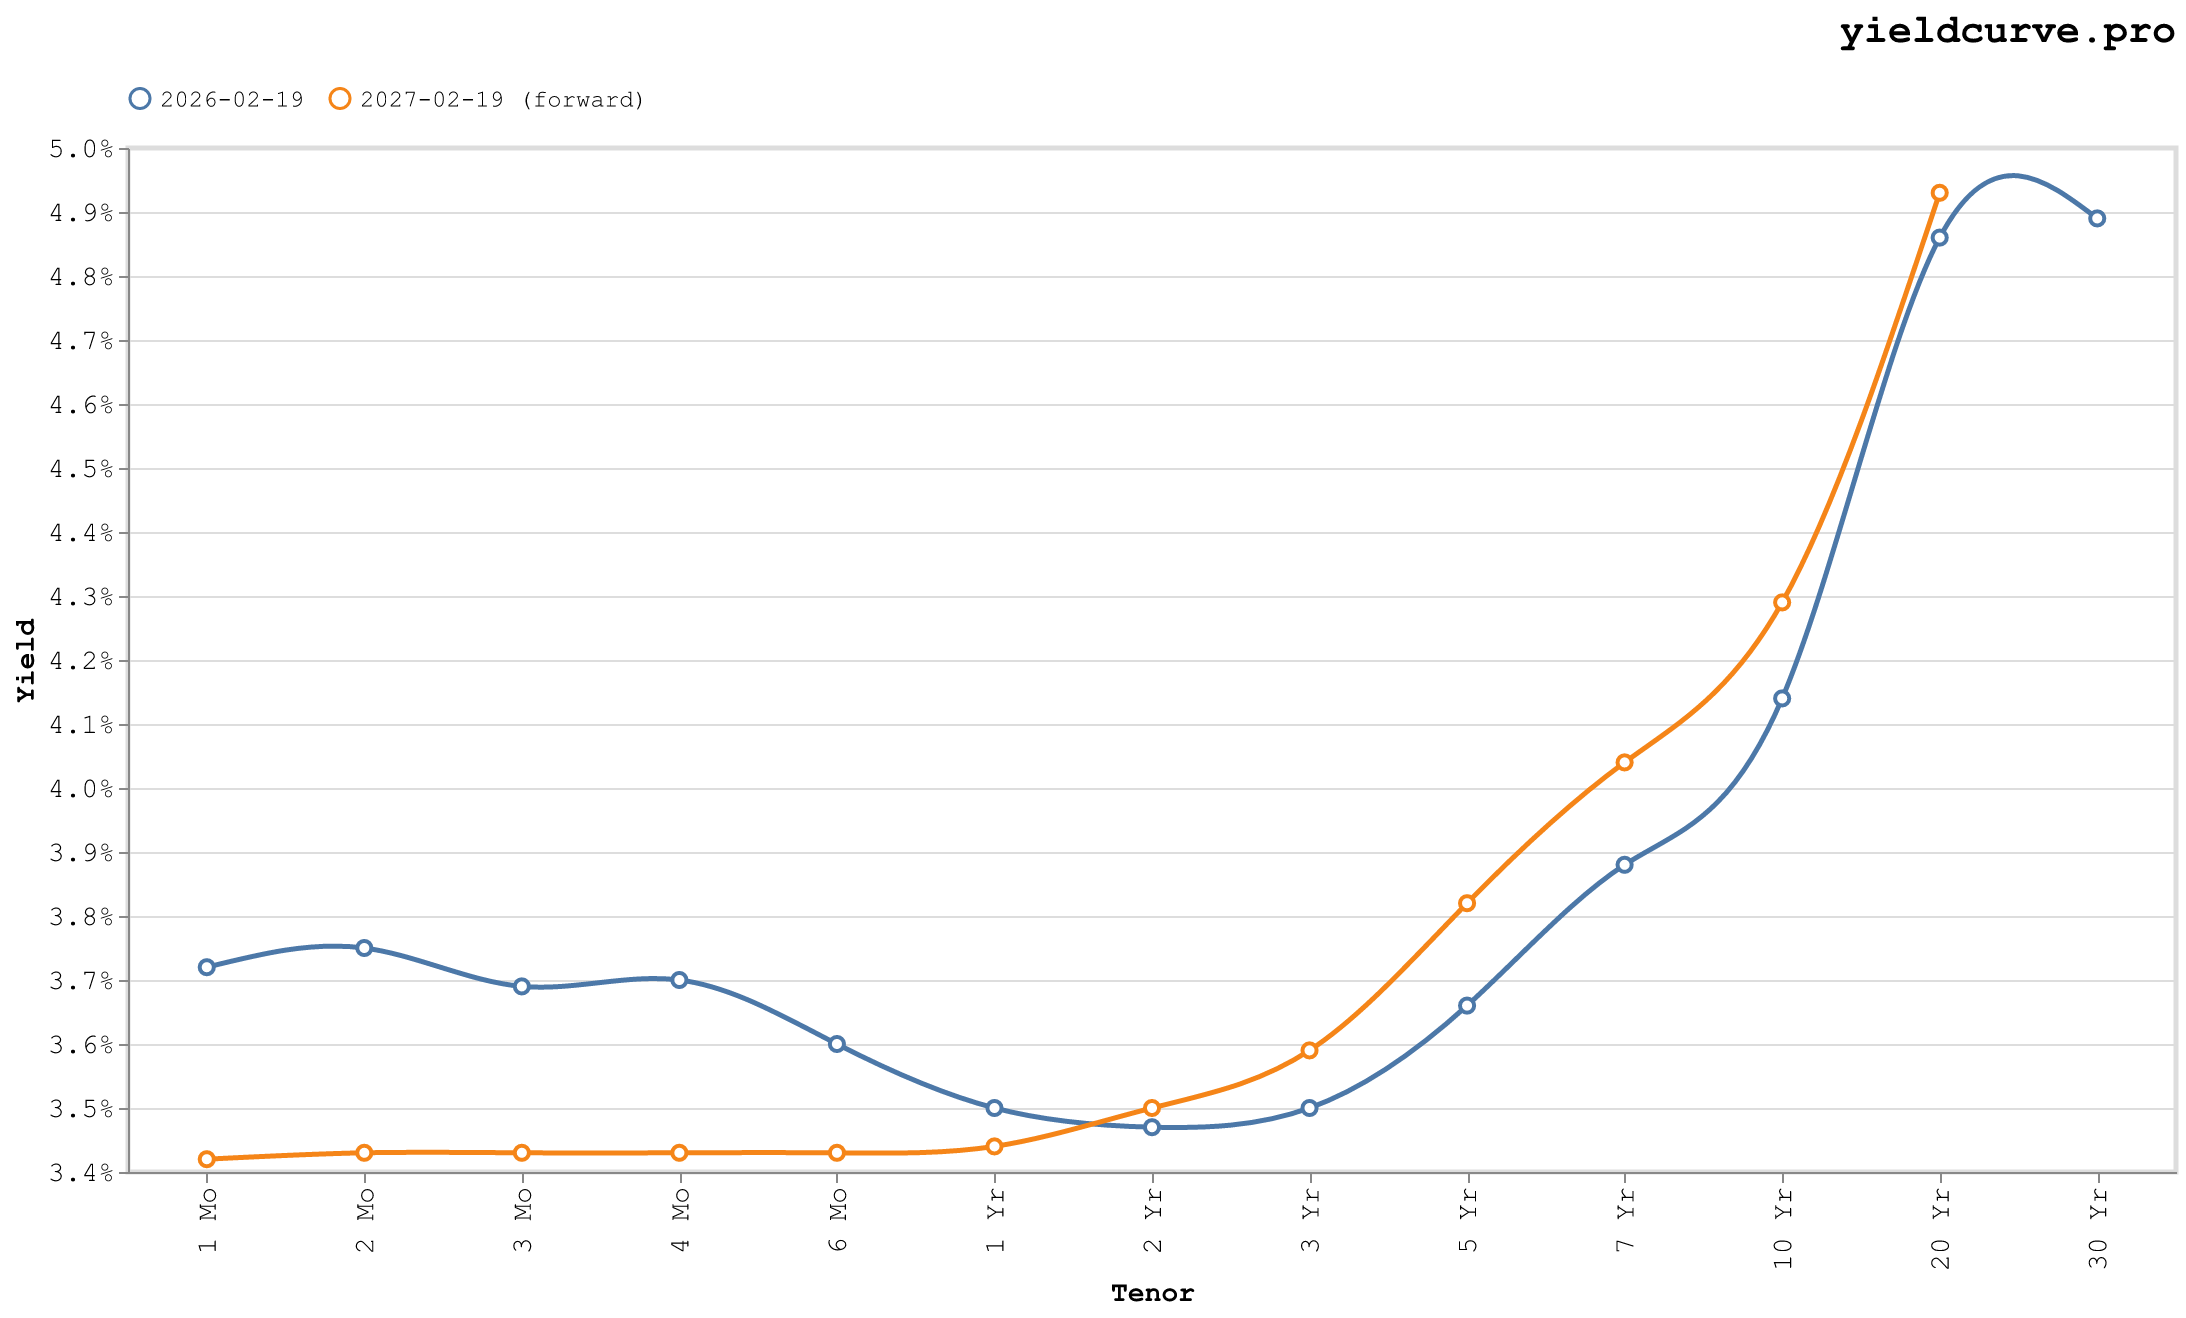
Figure 4: Spot Curve vs. 1-Yr Forward Curve (2026-02-19)
Today's spot curve dips from the front end down to a trough at the 2 Yr tenor before steepening sharply through the long end, with the 30 Yr approaching 4.9%. The forward curve sits below spot across the short end, crosses between the 1 Yr and 2 Yr, then diverges materially at the long end — the forward 20 Yr marginally exceeds spot before converging again at the 30 Yr. The market is not positioned for boom or bust. It is positioned for a slow grind: modestly lower short rates, a long end anchored by fiscal supply, and a Federal Reserve that has largely done its job.
FAQ
Did the yield curve inversion of 2022 to 2024 predict a recession?
No recession arrived during or immediately after the inversion. The 10 Yr minus 3 Mo spread had an 8-for-8 record predicting U.S. recessions since the 1960s before 2022, so this episode broke the streak. The post argues that structural forces overwhelmed the signal rather than invalidating the indicator's underlying mechanism.
What is the difference between 10Y-3M and 10Y-2Y as recession indicators?
Campbell Harvey's research, beginning with his 1986 dissertation under Eugene Fama, focused on 10 Yr minus 3 Mo. That spread carries an 8-for-8 track record since the 1960s with no false signals before 2022. The 10 Yr minus 2 Yr is a noisier proxy that gave a false signal in 1998 by briefly inverting without a recession following.
Is the Campbell Harvey yield curve signal broken?
Harvey himself has framed the 2022 episode as a misfire driven by cycle-specific fiscal and labor conditions, not as evidence the signal is broken. The mechanism that links short-rate tightening to recession through credit and investment remains intact. One miss in nine cycles does not establish that the indicator's information content has gone to zero.
What four forces overwhelmed the recession signal in this cycle?
Massive pandemic-era fiscal transfers extended consumer balance sheets, structural labor shortages floored employment, the fixed-rate mortgage stock insulated households from rate hikes, and AI-driven capital expenditure stimulated investment. The post argues each force individually was modest but their joint effect was enough to absorb the tightening shock that has historically triggered recession.
Members Only
Create a free account to keep reading.
Enter your email to get a verification code.
We sent a 6-digit code to .
Check your email and enter the code below.
Back
Sign in to leave a comment.
Comments (0)