Anatomy of a Failed Trade: The 2s10s Steepener
Itai Lourie at Unstable Equilibria has now written three pieces on the 2s10s curve steepener — August 2025, December 2025, and March 2026. Each carried the same warning: the trade bleeds time, the carry is negligible, and the steepening thesis keeps not arriving. The 2s10s spread peaked at +74 bps in January. By late March: +46 bps. Morningstar called more steepening "inevitable." WisdomTree turned the thesis into a product. DoubleLine endorsed it across portfolios. All three ran into a bear flattener.
Lourie's analysis covers August 2024 through March 2026 using historical rolling returns. Our tools use today's yield curve — the specific numbers differ, but the structural dynamics are identical. Below is a step-by-step walkthrough of the trade's mechanics using three calculators on yieldcurve.pro.
Step 1: What Is the Trade?
A 2s10s steepener bets the yield curve will get steeper — that the gap between the 10-year and 2-year yields will widen.
The position: long 2-year Treasuries, short 10-year Treasuries. If the 10-year yield rises relative to the 2-year (or the 2-year falls relative to the 10-year), the spread widens and the trade profits. But a 10-year bond moves far more per basis point of yield change than a 2-year bond. To isolate the spread bet from directional rate risk, you need to match the price sensitivity of both legs. That's called a DV01-neutral position.
Step 2: The Duration Mismatch
DV01 — dollar value of one basis point — measures how much a bond's price moves per \$100 face when yields shift 1 bp. The duration calculator computes this for any maturity.
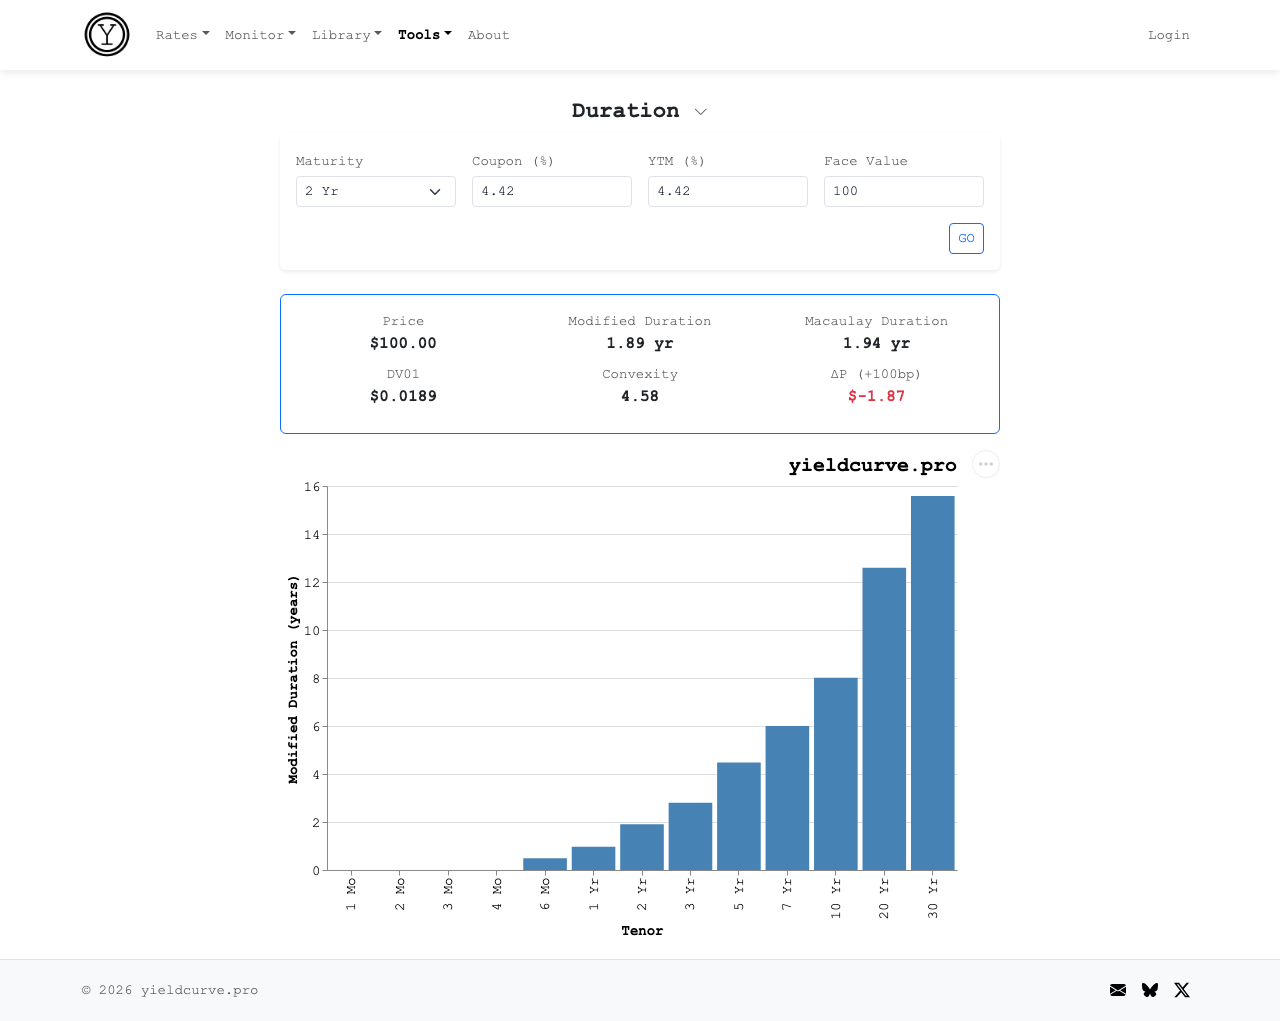
Figure 1: A 2 Yr par bond — modified duration 1.89 years, DV01 \$0.0189 per \$100 face. If the 2 Yr yield rises 1 bp, this bond loses 1.9 cents.

Figure 2: A 10 Yr par bond — modified duration 8.01 years, DV01 \$0.0801 per \$100 face. A 1 bp move costs 8 cents — 4.24x the 2 Yr.
Try the duration calculator on yieldcurve.pro
The ratio: \$0.0801 / \$0.0189 = 4.24x. To build a DV01-neutral steepener, you need \$424 of 2-year face for every \$100 of 10-year face. That matches the dollar risk — both legs move the same amount per basis point of parallel yield change. Total capital: \$524 of face value per \$100 of 10-year notional.
Step 3: The Carry Arithmetic
While you hold a bond, it earns two kinds of return (assuming the curve doesn't move):
- Carry: income above the funding rate. If the bond yields 4.42% and you fund at 3.73%, carry = +69 bps/yr.
- Rolldown: as a bond ages, it rolls down the curve to a lower yield and gains in price.
The carry & rolldown calculator decomposes both for every tenor at a 1-year horizon:
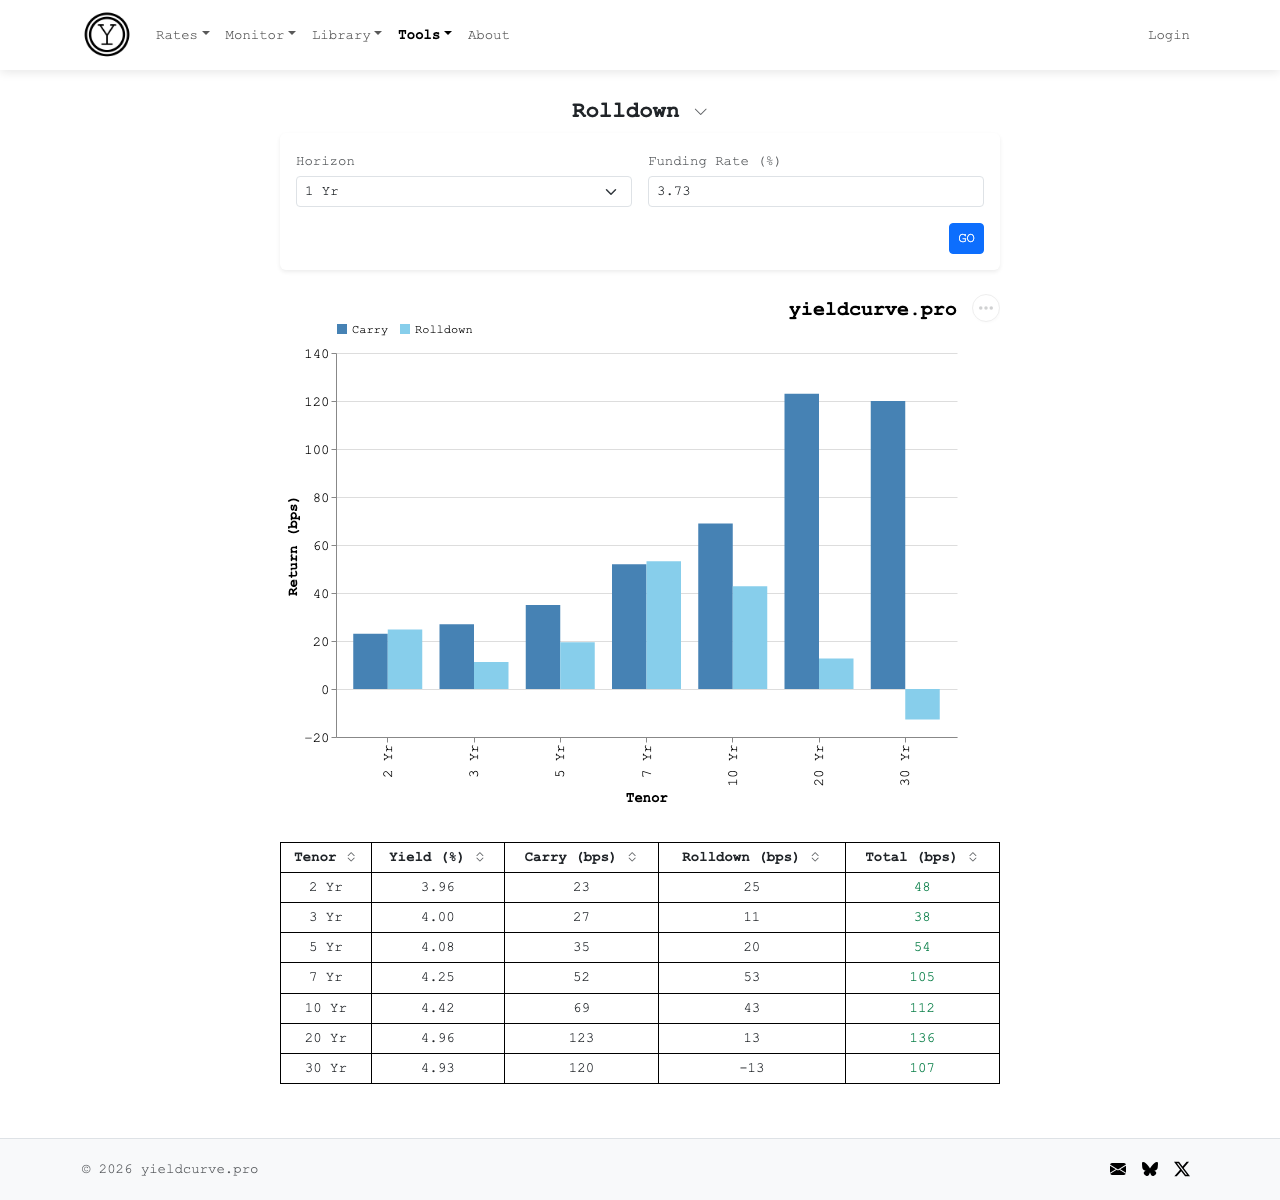
Figure 3: Carry and rolldown by tenor over a 1 Yr horizon, funded at 3.73%. The 10 Yr earns +112 bps total. The 2 Yr earns +48 bps.
Try the rolldown calculator on yieldcurve.pro
On the steepener, you earn the 2-year's return (you own it) and pay the 10-year's return (you're short — you owe the coupon and forfeit the rolldown). Scale to the DV01-neutral position and express in bps on the \$524 of deployed capital:
| Component | Long 2Y (\$424 face) | Short 10Y (\$100 face) | Net (bps on \$524) |
|---|---|---|---|
| Carry | +19 | −13 | +5 bps/yr |
| Rolldown | +20 | −8 | +12 bps/yr |
| Total | +39 | −21 | +18 bps/yr |
Table 1: Carry and Rolldown for 2 Yr and 10 Yr Treasuries.
The steepener earns +18 bps per year on capital. Not negative. Not zero. But razor-thin. That +18 bps is the entire cushion against any adverse spread move.
The 2s10s compressed 28 bps from January to March — roughly two months. Carry earned over that period: about +3 bps. Spread loss: −43 bps. Net: −40 bps on capital. The income covered 7% of the loss. Lourie calls it a carry hole. The name fits.
Step 4: What the Trade Needed
The steepener's bull case: the Fed cuts aggressively, the front end rallies, the back end stays anchored. The scenario simulator models this — the "Bull Steepener" preset drops short rates 100 bps and leaves the long end unchanged.
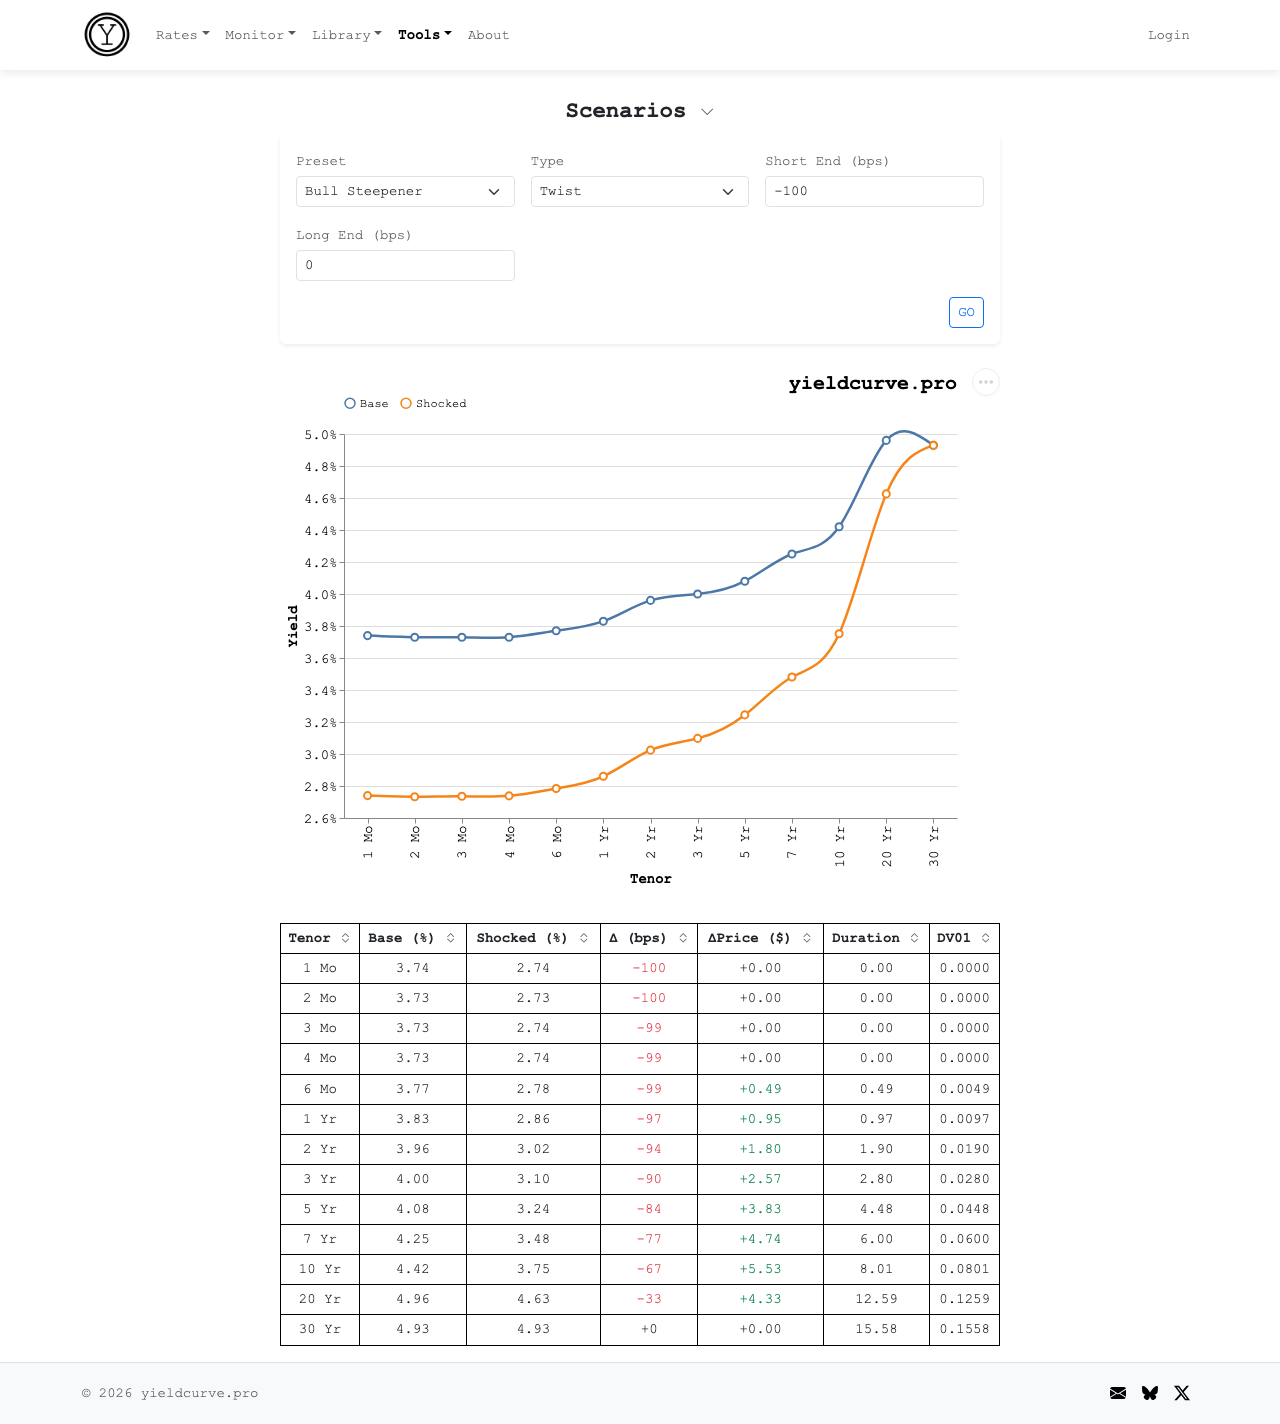
Figure 4: Bull Steepener scenario — front end drops 100 bps, long end unchanged. The trade the consensus was positioned for.
Try the scenario simulator on yieldcurve.pro
Walk through each leg of the DV01-neutral position:
- 2 Yr (long): yield falls 94 bps (3.96% → 3.02%), price gains +\$1.80 per \$100 face. You own this — it's your profit.
- 10 Yr (short): yield falls 67 bps (4.42% → 3.75%), price gains +\$5.53 per \$100 face. You're short — this price rise is your loss.
On the DV01-neutral position: long leg gain = 4.24 × \$1.80 = +\$7.63. Short leg loss = −\$5.53. Net: +\$2.10, or +40 bps on \$524 of capital. The steepener profits, but \$2.10 on \$524 of face deployed — for a scenario requiring 100 bps of Fed cuts with a perfectly anchored long end — is a thin reward for a specific bet.
Step 5: What the Trade Got
Instead: a bear flattener. Both ends sold off. The 2-year harder than the 10-year. Fourteen of nineteen Fed participants now see zero or one cut in 2026. The longer-run neutral rate ticked up to 3.1%. Powell called it "the high end of neutral." The engine the steepener needed — aggressive cutting — is priced out.
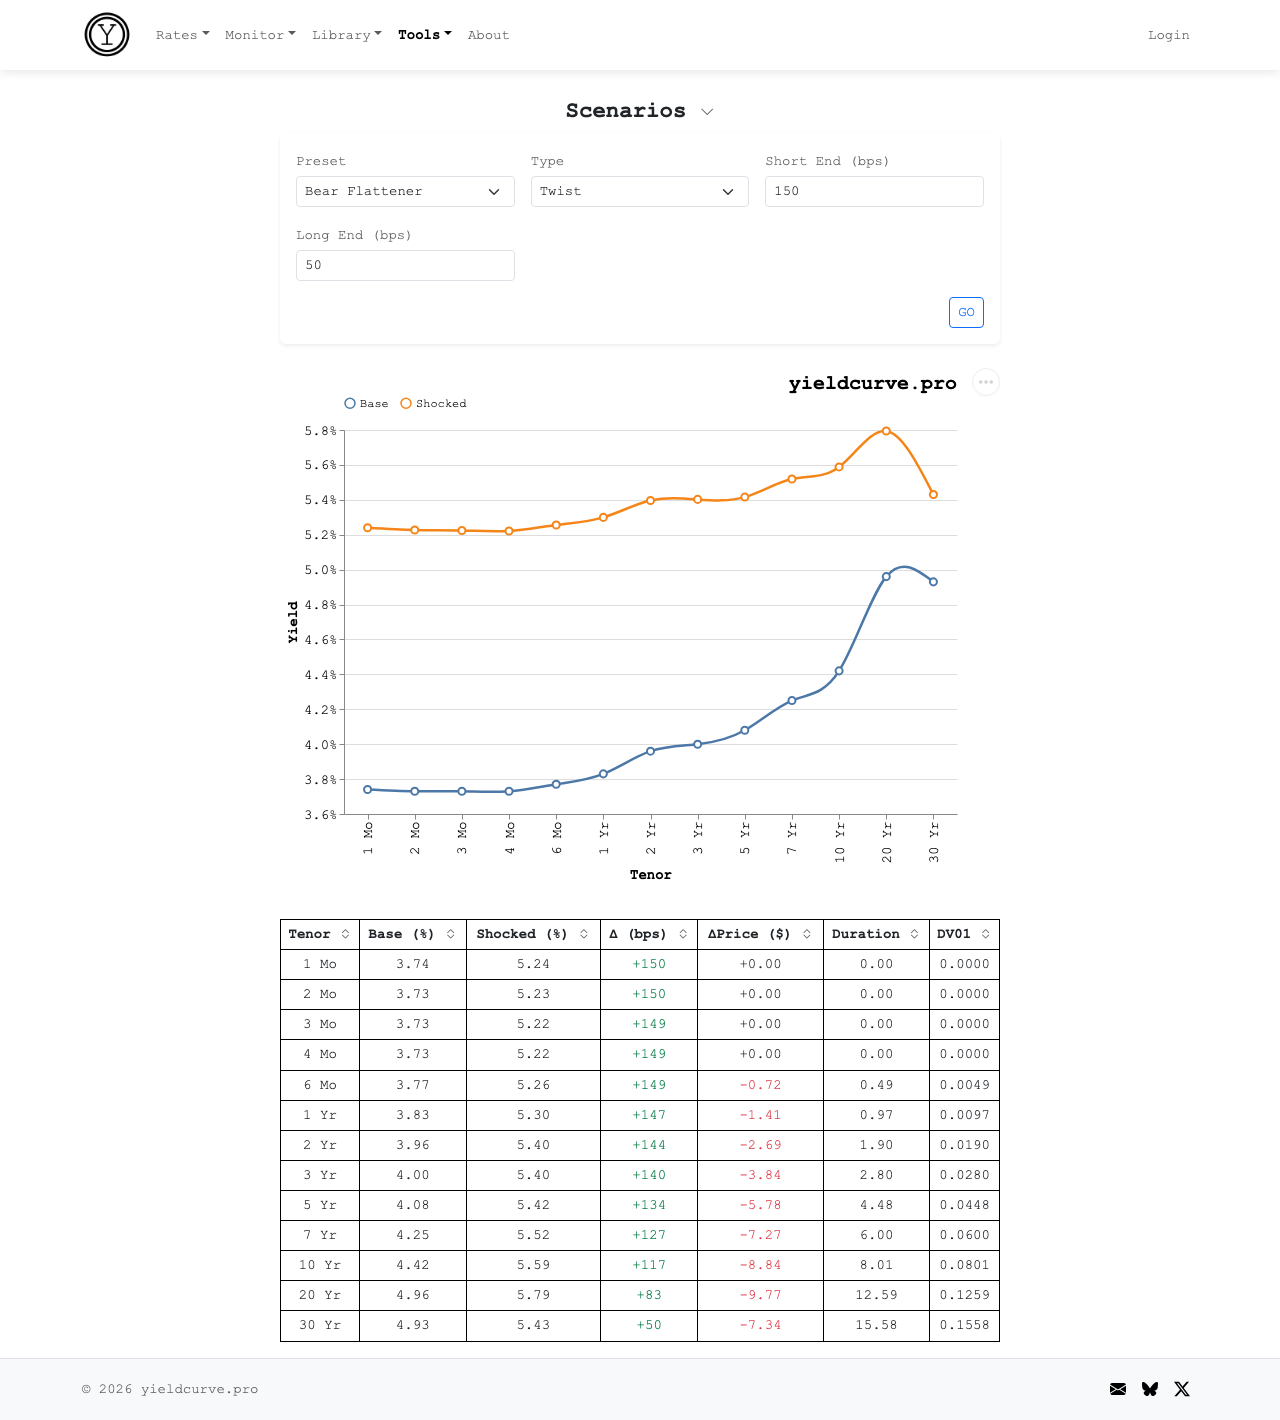
Figure 5: Bear Flattener — short rates +150 bps, long rates +50 bps. What the market delivered.
Try the scenario simulator on yieldcurve.pro
Each leg:
- 2 Yr (long): yield rises 144 bps (3.96% → 5.40%), price drops −\$2.69. You own this — it's your loss.
- 10 Yr (short): yield rises 117 bps (4.42% → 5.59%), price drops −\$8.84. You're short — this price drop is your gain.
On the DV01-neutral position: long leg loss = 4.24 × (−\$2.69) = −\$11.41. Short leg gain = +\$8.84. Net: −\$2.57, or −49 bps on \$524 of capital. The spread compressed and you lost money. The DV01 hedge absorbed the parallel component of the selloff — without it, the directional losses would have been far worse — but it couldn't protect against the twist.
The Alternative
Lourie offers three alternatives. The simplest: own the 5-year outright.
The rolldown calculator shows the 5 Yr earns +35 bps of carry and +20 bps of rolldown for +54 bps total — three times the steepener's +18 bps, with none of the structural complexity. If the Fed does cut, the scenario simulator shows the 5-year gaining +\$3.83 per \$100 face on a −100 bps shift. No DV01 matching. No 4x capital. No spread construction.
One caveat. Over the January-to-March bear market, the 5-year outright lost more than the steepener — roughly −219 bps on capital, vs the steepener's −40 bps. The 5Y yield rose +51 bps and the directional position ate the entire move. The steepener's DV01 hedge protected against the parallel selloff.
The 5-year is the better trade if cuts arrive. It is not unconditionally better. It depends on whether you're positioning for a level move or a shape move — and whether you're willing to take directional risk to express it.
The 2s10s steepener is a compelling narrative about curve normalization. As a trade, its structural handicap — 4x capital, thin carry, vulnerability to any flattening — means the thesis has to be overwhelmingly right just to break even. Lourie has said this three times. The duration, rolldown, and scenario calculators let you check the math yourself.
FAQ
Why does a 2s10s steepener require 4x more capital than a directional Treasury position?
A DV01-neutral 2s10s steepener requires long-2-year and short-10-year positions sized so each leg moves the same dollar amount per basis point. Since the 2-year has roughly one-quarter the DV01 of the 10-year, the long 2-year leg must be roughly 4x the face value of the short 10-year leg. The trade thus consumes 4x the gross notional of a single-tenor position.
What is a bear flattener and why does it kill a 2s10s steepener?
A bear flattener is a curve move where short-end yields rise more than long-end yields, flattening the curve while overall rates rise. A 2s10s steepener loses on both legs in this regime: the long 2-year falls in price, the short 10-year falls less, and the spread narrows against the trade. The position can lose money even in a parallel-up move depending on hedge construction.
How is the DV01 hedge ratio for a 2s10s steepener computed?
The hedge ratio is $\text{ratio} = \text{DV01}{10Y} / \text{DV01}$. Since a typical 10-year par bond has roughly 4.5× the DV01 of a 2-year par bond, you need approximately 4.5 notional dollars of 2-year for every notional dollar of 10-year to neutralize parallel-shift risk.
Is the carry on a 2s10s steepener typically large enough to offset the trade's risk?
No. The post documents +18 bps per year of carry on the DV01-neutral position, which is small relative to the trade's volatility. A 5-year outright position generates roughly three times that carry plus meaningful rolldown, without DV01 matching or 4x capital. Steepeners trade for shape conviction, not income.
Back
Sign in to leave a comment.
Comments (0)