Are BTC ETF Managers Doing A Good Job (Part 2)?
Part 1 concluded with us proclaiming that either the current stable of Bitcoin ETF managers were doing a shit job or our tracking error analysis was off. Well...it was the analysis. We compared ETF closing prices set at 4pm EST against a Bitcoin price stamped at midnight UTC. Bitcoin trades for another three or four hours in between.
Two and a half years of additional data let us do the job properly this time. The sample below runs from January 11, 2024 (the first day of trading) through September 21, 2026 for a total of 675 observations.
As a reminder, tracking error is the annualized standard deviation of the difference between a fund's daily return and its benchmark's.
The Clock
The bitcoin data for our first blog post came from Yahoo Finance, whose daily close is the last price before midnight UTC. That is 7pm EST or 8pm during day light saving time. Bitcoin at 49% annualized volatility moves plenty in those hours. This time we took bitcoin prices from Coinbase at the same time ETF trading closes. We call this series "Bitcoin at the close".
The Rerun
We ran the original analysis through the original full sample of data. Then we ran the same code against "Bitcoin at the close". Table 1 shows the results.
| Symbol | Midnight UTC | At the close |
|---|---|---|
| IBIT | 20.84% | 1.37% |
| FBTC | 20.79% | 1.34% |
| GBTC | 20.77% | 1.19% |
| ARKB | 20.77% | 1.28% |
| BITB | 20.67% | 1.10% |
| HODL | 20.66% | 1.39% |
| BRRR | 20.64% | 1.13% |
| BTCO | 20.66% | 1.30% |
| EZBC | 20.71% | 1.39% |
| BTCW | 20.81% | 1.75% |
Table 1: Annualized tracking errors: flawed vs updated.
Beta tells the same story. Beta is the slope from regressing a asset's daily returns on another target asset. Against "Bitcoin at the close" the ten funds have betas of 1.000 to 1.009 and correlations of 0.999 or better. Against the original Yahoo price series they had a beta of 0.93 and a correlation of 0.91.
The original post noted that tracking error "increased steadily" through early 2024 while blamed rising volatility. The cause was arithmetic. We originally used a rolling 252-day window but let it report after only 30 days. The early values rested on only a few observations. Figure 1 uses the same lookback window but waits for at leaset 120 days of history.
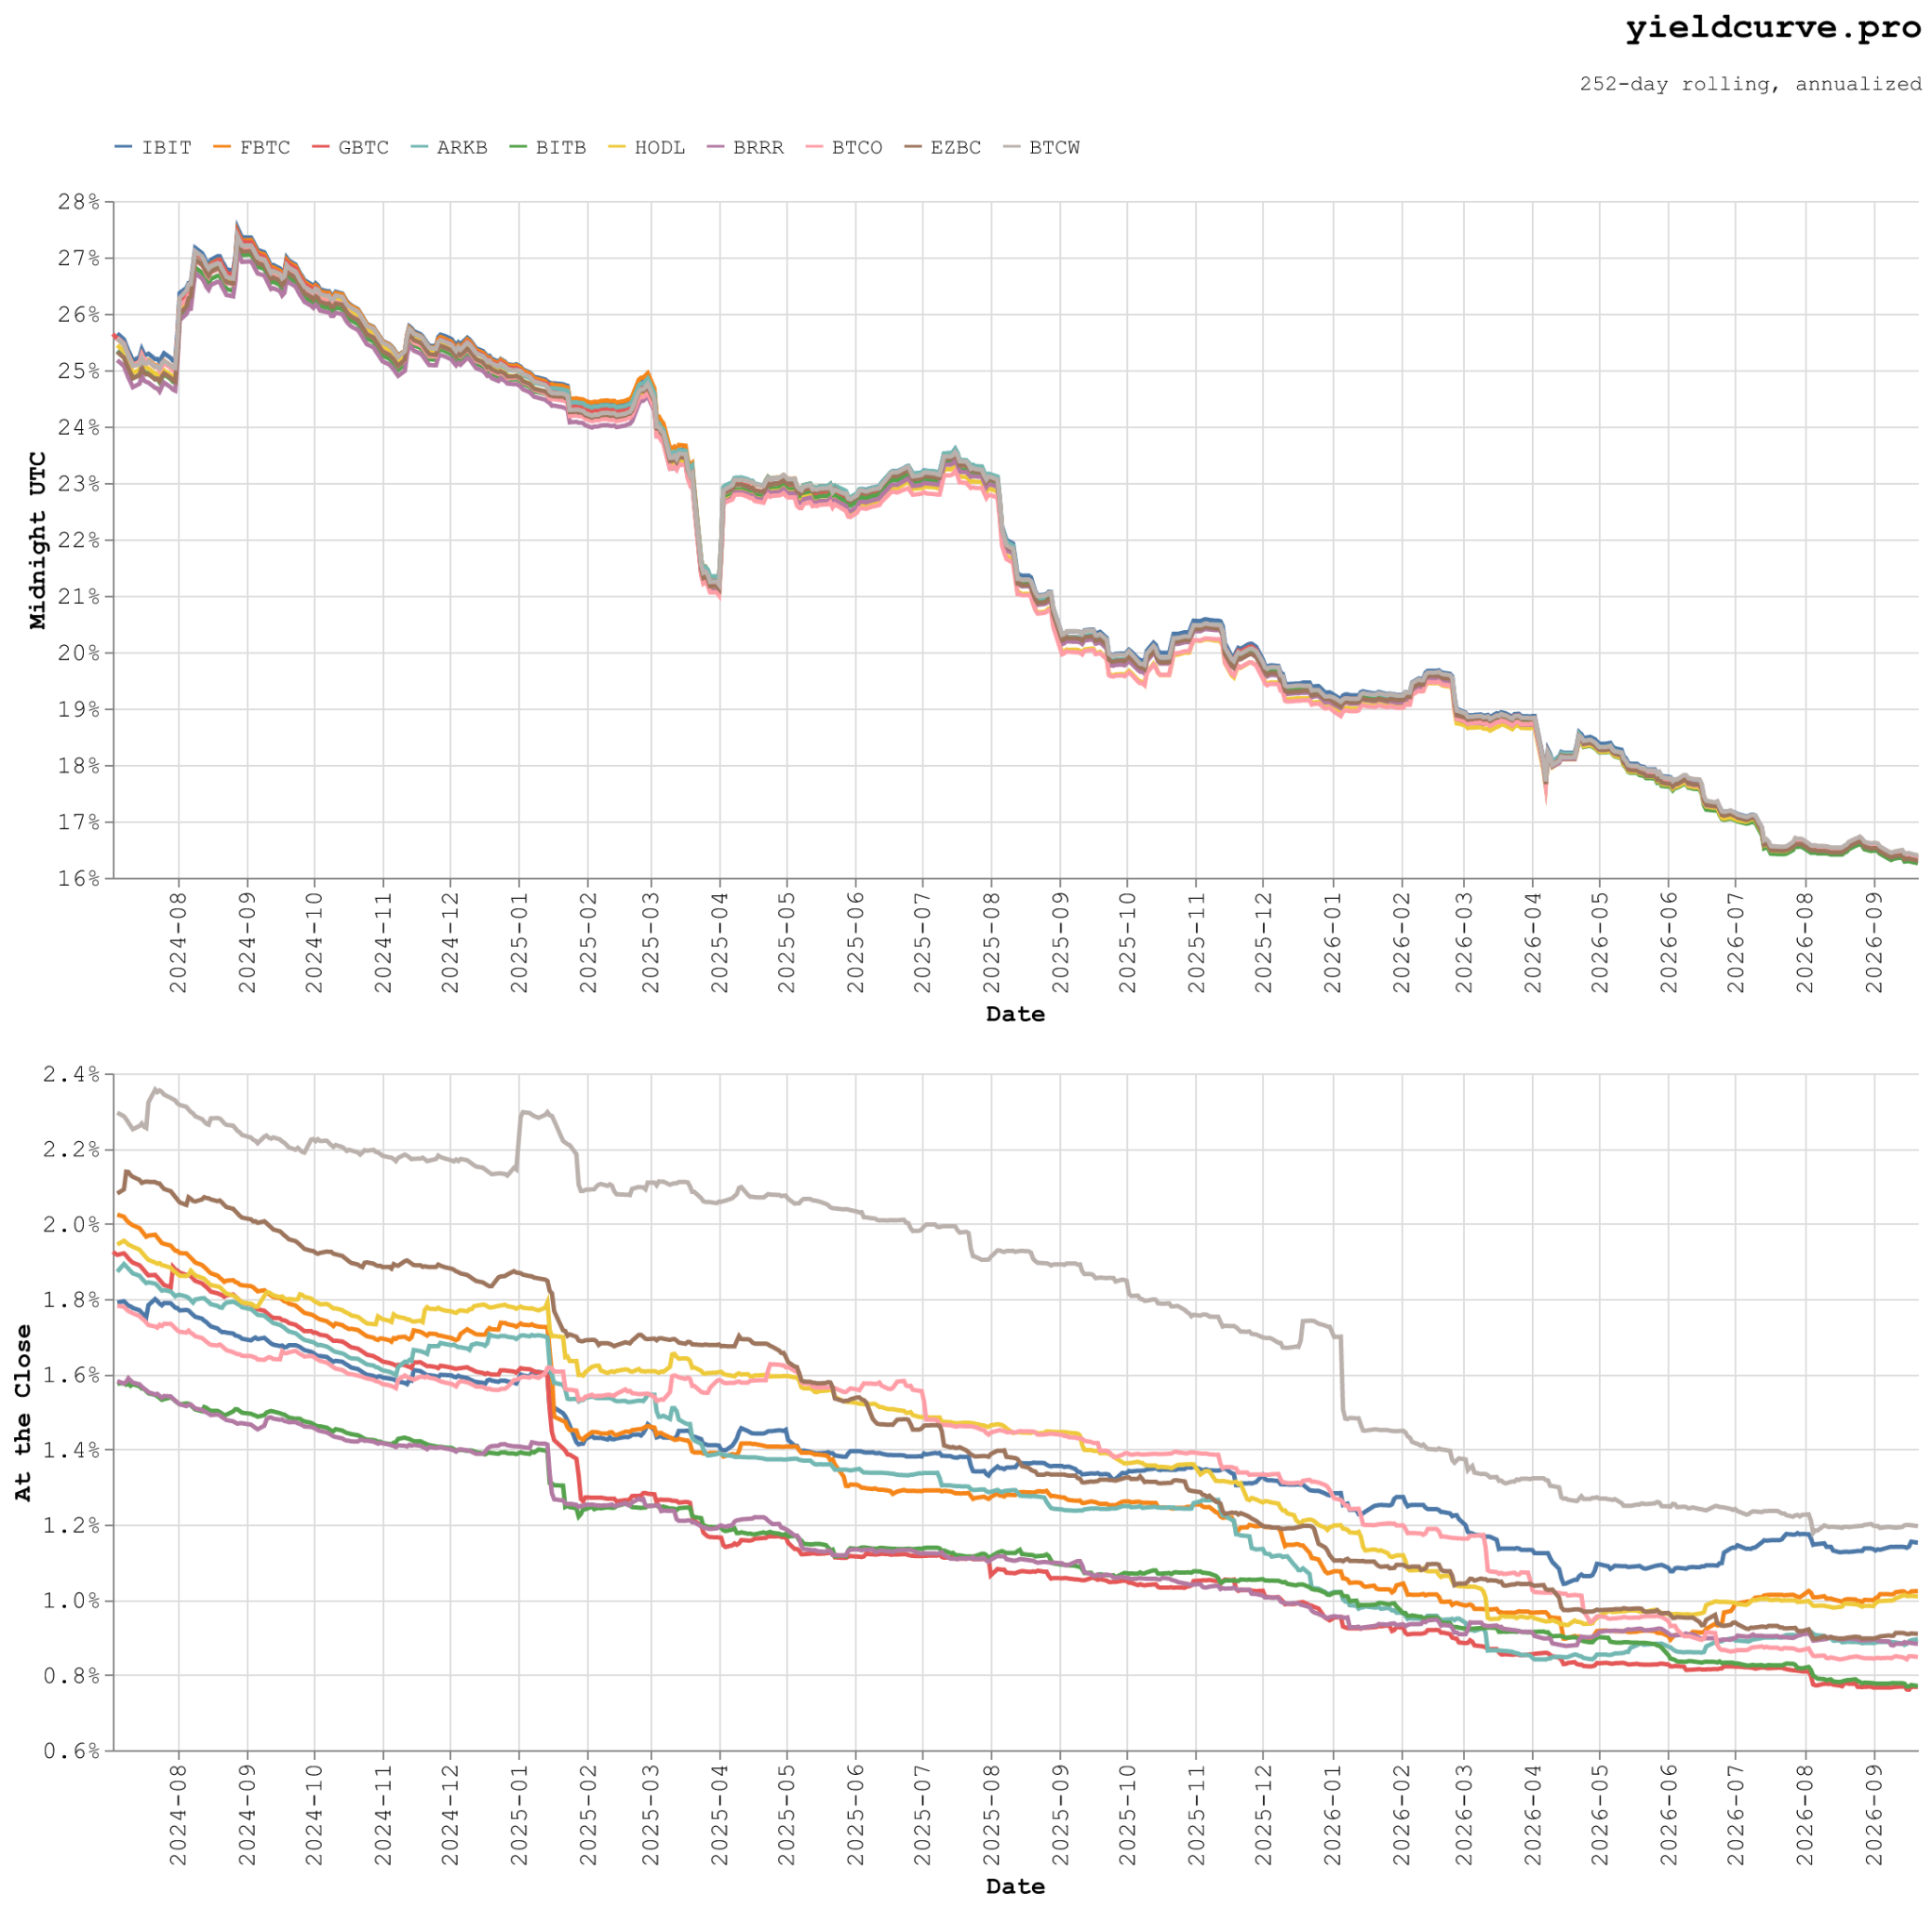
Figure 1: Rolling 252-day tracking error, midnight-UTC bitcoin (top) vs "Bitcoin at the close".
The updated tracking errors have fallen for two years. The ETF tracking errors ran at 1.4% to 2.1% in 2024, 1.0% to 1.7% in 2025, and 0.7% to 1.2% so far in 2026.
The Yardstick
As a comparison we computed tracking errors for SPY, IVV, and VOO, the three largest S&P 500 ETFs. We used closing prices without dividend adjustments and dropped the days each ETF paid a dividend. SPY measures 0.87%, IVV at 0.97%, and VOO at 0.75%.
One note on data, Yahoo's SPY close for April 9, 2025 is the day's high,
not the close. It sits 1.06% above the last hourly price. State Street's
own NAV and premium history put the close at \$543.44, so we used that.
We then checked every daily close we use against its last hourly price for
consistency. We'd prefer to not look stupid twice.
In Part 1 we wrote tracking error in terms of three quantities, the volatility of the fund, the volatility of its index, and the correlation between the two. We then assumed that a fund and its index share the same volatility, and that a skilled manager can achieve comparable correlation to the index they are trying to track. Under those assumptions
$$\frac{TE_{BTC}}{\sigma_{BTC}} = \frac{TE_{SPY}}{\sigma_{SPY}}$$
In words, tracking error divided by index volatility should be the same for equally skilled managers. Table 2 shows that ratio for the three S&P 500 funds and for the largest, tightest, and loosest bitcoin funds.
| Symbol | Tracking error | Index volatility | Tracking error / volatility |
|---|---|---|---|
| SPY | 0.87% | 15.3% | 5.7% |
| IVV | 0.97% | 15.3% | 6.3% |
| VOO | 0.75% | 15.3% | 4.9% |
| IBIT | 1.37% | 48.9% | 2.8% |
| BITB | 1.10% | 48.9% | 2.3% |
| BTCW | 1.75% | 48.9% | 3.6% |
Table 2: Price-based tracking errors, volatilities, and ratios.
Measured the same way, the largest S&P 500 ETF and the largest bitcoin ETF are half a point apart.
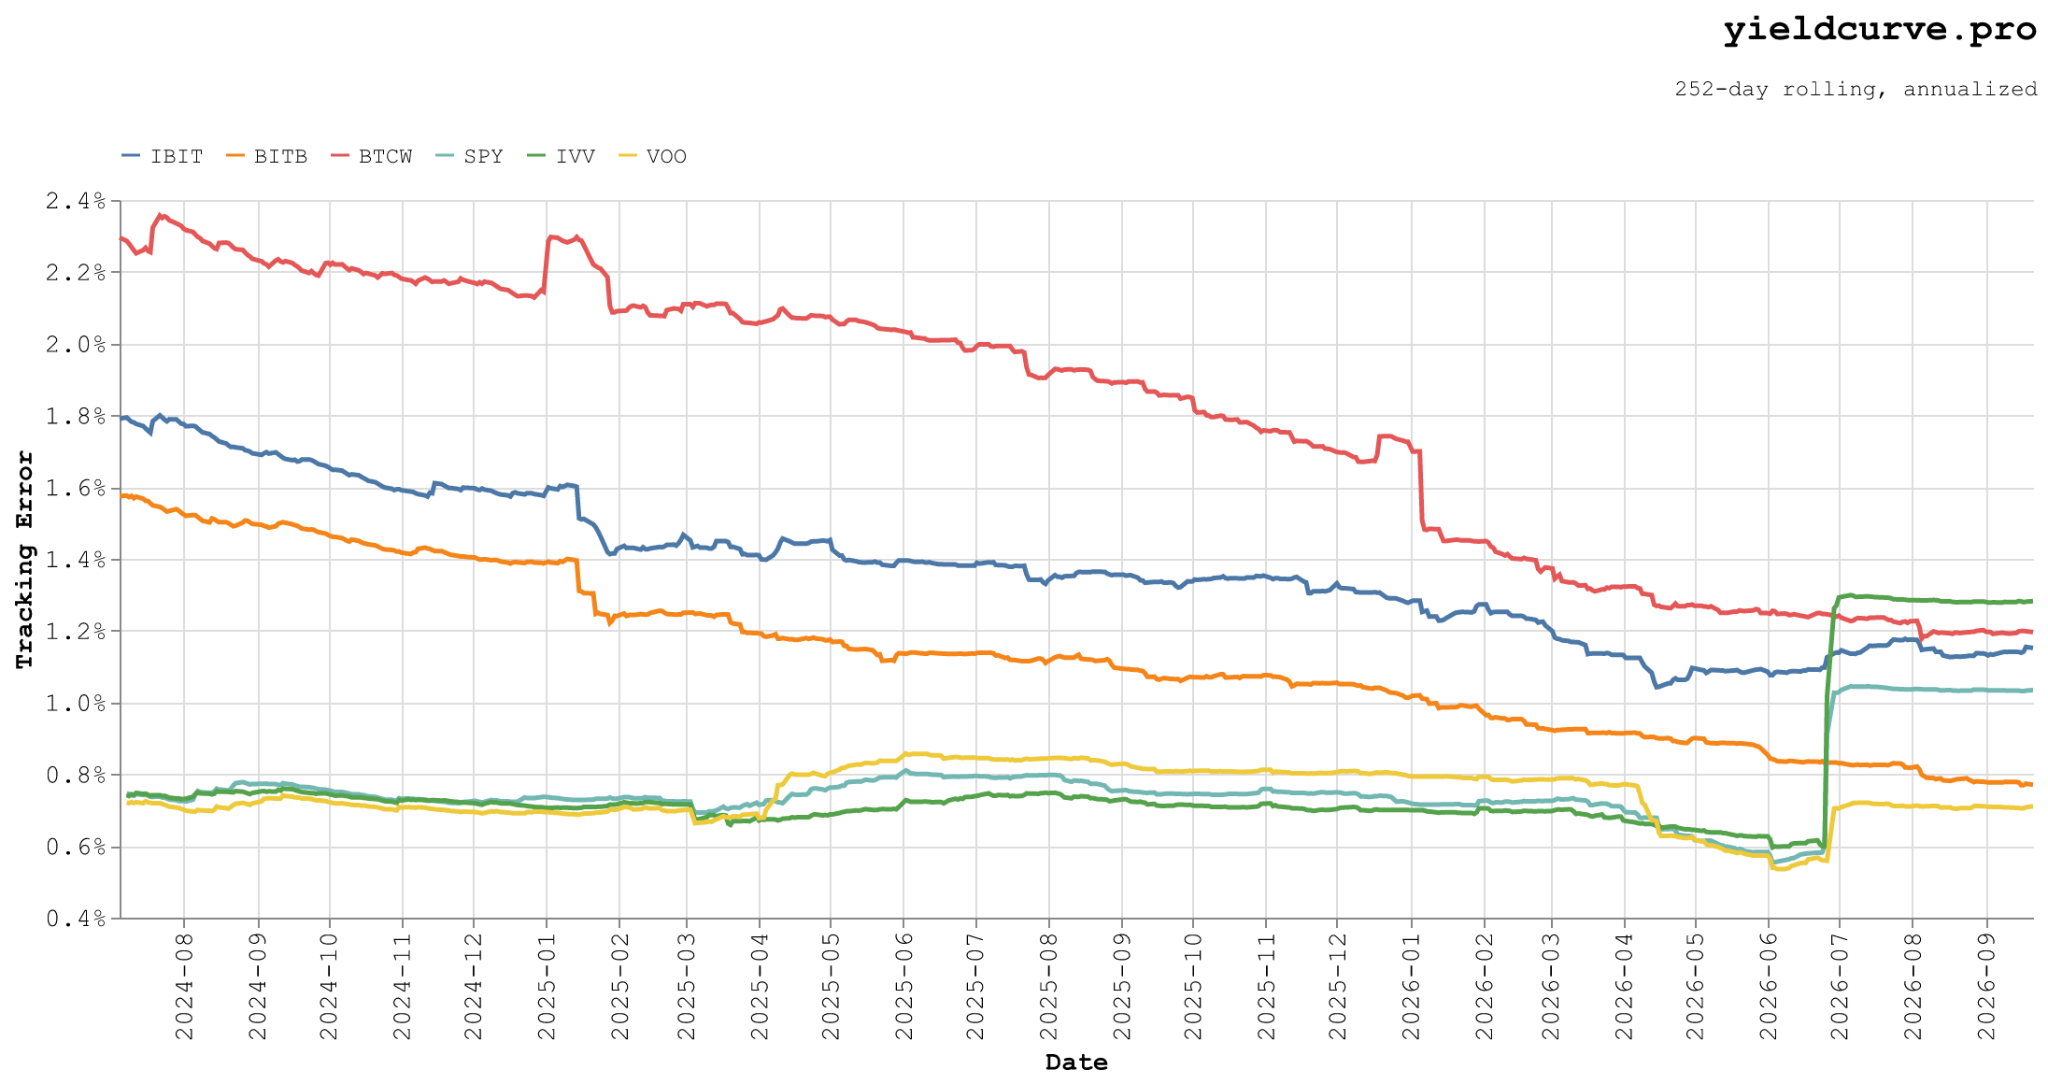
Figure 2: Rolling 252-day tracking errors. The June 2026 step up in the equity ETFs is the day SPY closed 0.47% below NAV.
Who Tracks Tightest
So which Bitcoin ETF manager does the best job? Table 3 presents a variety of different measures. The third column shows tracking errors for last 63 trading days.
| Symbol | Full sample | Excluding Jan and Feb 2024 | Latest 63 days | Fee (bps) | Assets (\$B) |
|---|---|---|---|---|---|
| BITB | 1.10% | 1.02% | 0.66% | 20 | 3.32 |
| BRRR | 1.13% | 1.05% | 0.82% | 25 | 0.49 |
| GBTC | 1.19% | 1.01% | 0.64% | 150 | 11.01 |
| ARKB | 1.28% | 1.18% | 0.89% | 21 | 2.68 |
| BTCO | 1.30% | 1.26% | 0.78% | 25 | 0.41 |
| FBTC | 1.34% | 1.20% | 1.24% | 25 | 13.87 |
| IBIT | 1.37% | 1.28% | 1.31% | 25 | 67.91 |
| HODL | 1.39% | 1.28% | 0.91% | 20 | 1.27 |
| EZBC | 1.39% | 1.31% | 0.90% | 19 | 0.43 |
| BTCW | 1.75% | 1.65% | 1.12% | 25 | 0.17 |
Table 3: Annualized tracking error against "Bitcoin at the close". Fees and assets as of September 21, 2026.
Bitwise is the tightest in the group. It is first over the full
sample, first excluding the launch months, and second over the latest
quarter. Fees have not moved since our first post. GBTC still charges 150 bps
and the rest charge 19 to 25 bps. Grayscale also launched a cheaper Bitcoin Mini
Trust (ticker BTC) in July 2024. We left it out to keep the original uninverse
intact. Assets under management appear to have nothing to do with efficacy.
IBIT holds about two thirds of the money in the table and sits seventh on tracking error.
What Part 1 Got Right
Our first post named three suspects. They were trading hours, fees, and the lack of a closing auction. It guessed the first two did not matter. The order was backwards. Trading hours were the whole story.
We asked anyone who knows how these funds are run to educate us. Nobody wrote in, so we educated ourselves. The Feedback line is still open.


Back
Sign in to leave a comment.
Comments (0)