D Is for Demand
The Treasury auctioned \$183 billion in coupon notes this week. The market gave it a D.
Monday's 2-Year scored a composite D. Tuesday's 5-Year managed a C-. Wednesday's 7-Year landed at D+. Three auctions, three grades no Treasury official wants to see — all while Brent crude trades above \$108 per barrel and the 10-Year yield climbs +44 bps in five sessions, from 3.97% to 4.41%.
War does not break bond markets. Bad auctions do.
What the Grades Mean
yieldcurve.pro's auction grading system scores every Treasury auction on four metrics: Tail, Bid-to-Cover, Indirect Bidders, and Direct Bidders. Each metric is normalized against its own history using Z-scores, then mapped to a letter grade from A through D-. The composite grade averages all four.
A D means the auction fell in the bottom quartile of its historical distribution. Buyers showed up. Barely.
Monday: The 2-Year Warning
The 2-Year Note opened the week with a tail of +7.1 bps (D-), a bid-to-cover of 2.44x (D-), indirect participation of 59.4% (C), and direct bidders at just 16.5% (D). Composite: D.
A +7.1 bps tail means dealers sold the note 7.1 basis points cheap relative to the when-issued market to fill the book. That spread measures urgency. A wider tail means the pre-auction market overestimated demand.
Tuesday: Marginal Improvement
The 5-Year Note narrowed the tail to +5.7 bps (C), but the bid-to-cover ratio dropped to 2.29x (D-). Indirect participation held at 61.9% (C-), and directs came in at 22.5% (C-). Composite: C-.
Better than Monday on one metric, worse on another. Foreign central banks — the bulk of indirect bidders — pulled back at the belly of the curve. When the largest marginal buyers of Treasury debt step back from the 5-Year, that is not noise.
Wednesday: The 7-Year Verdict
The final auction confirmed the pattern. The 7-Year Note — the hardest maturity to place in a sell-off because it sits between the belly and the long end — printed a tail of +6.5 bps (D-), a bid-to-cover of 2.43x (D), indirect participation of 62.6% (C-), and direct participation of 25.0% (C). Composite: D+.
Four charts tell the story.
Tail: +6.5 bps (D-)
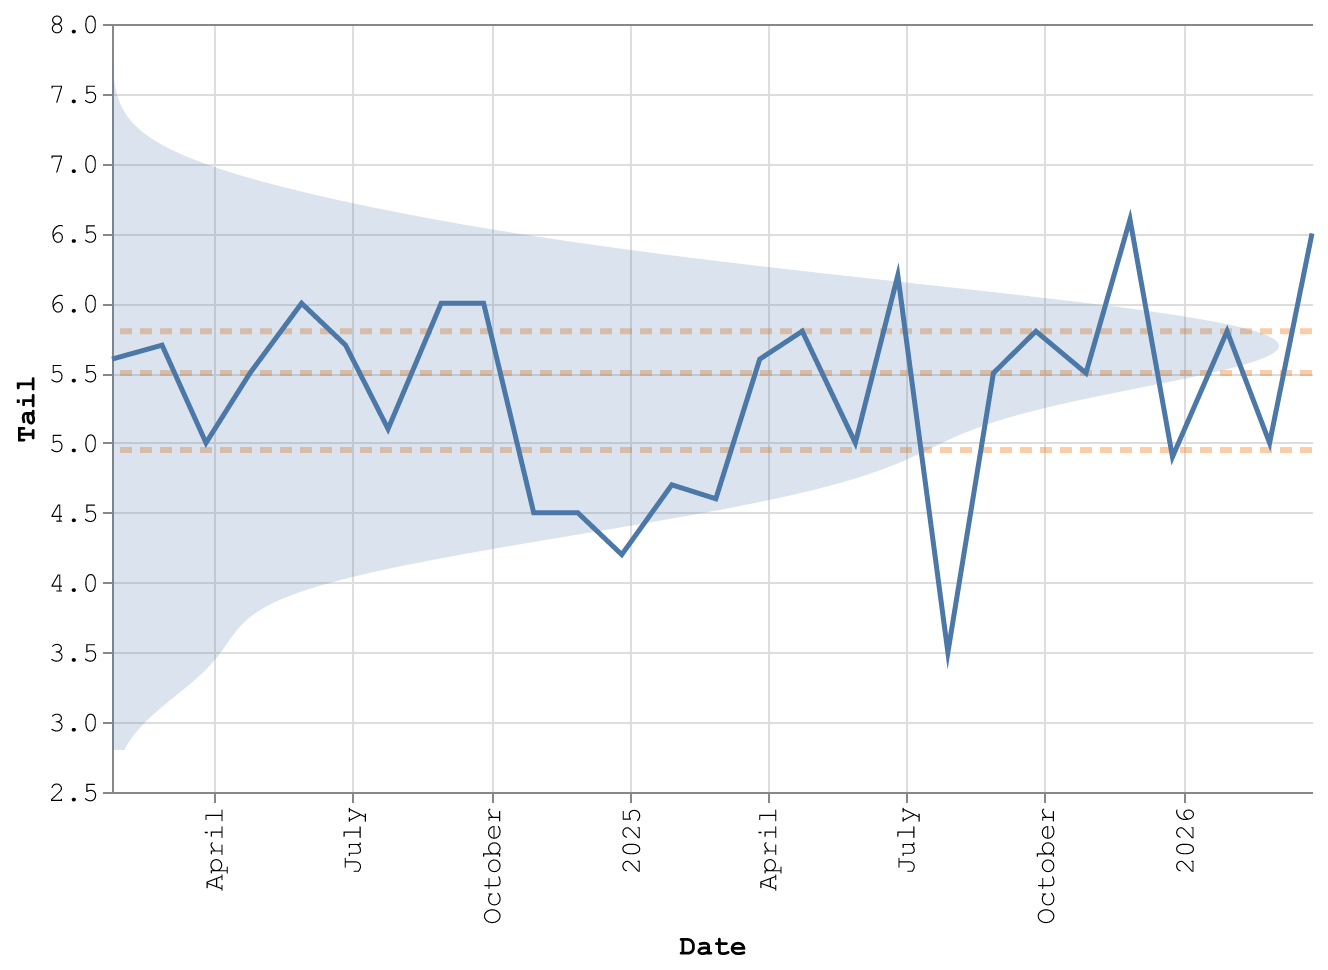
Figure 1: 7-Year Note tail (bps) since 2024. March 26 auction at +6.5 bps — above Q3, graded D-.
The tail measures the gap between the auction's high yield and the when-issued yield at the 1 PM cutoff. At +6.5 bps, this auction sits above the third quartile — fewer than 25% of recent 7-Year auctions have tailed this wide. The trend line shows tails drifting upward since mid-2025. The density band narrows around higher values. The market consistently misprices 7-Year demand.
Bid-to-Cover: 2.43x (D)
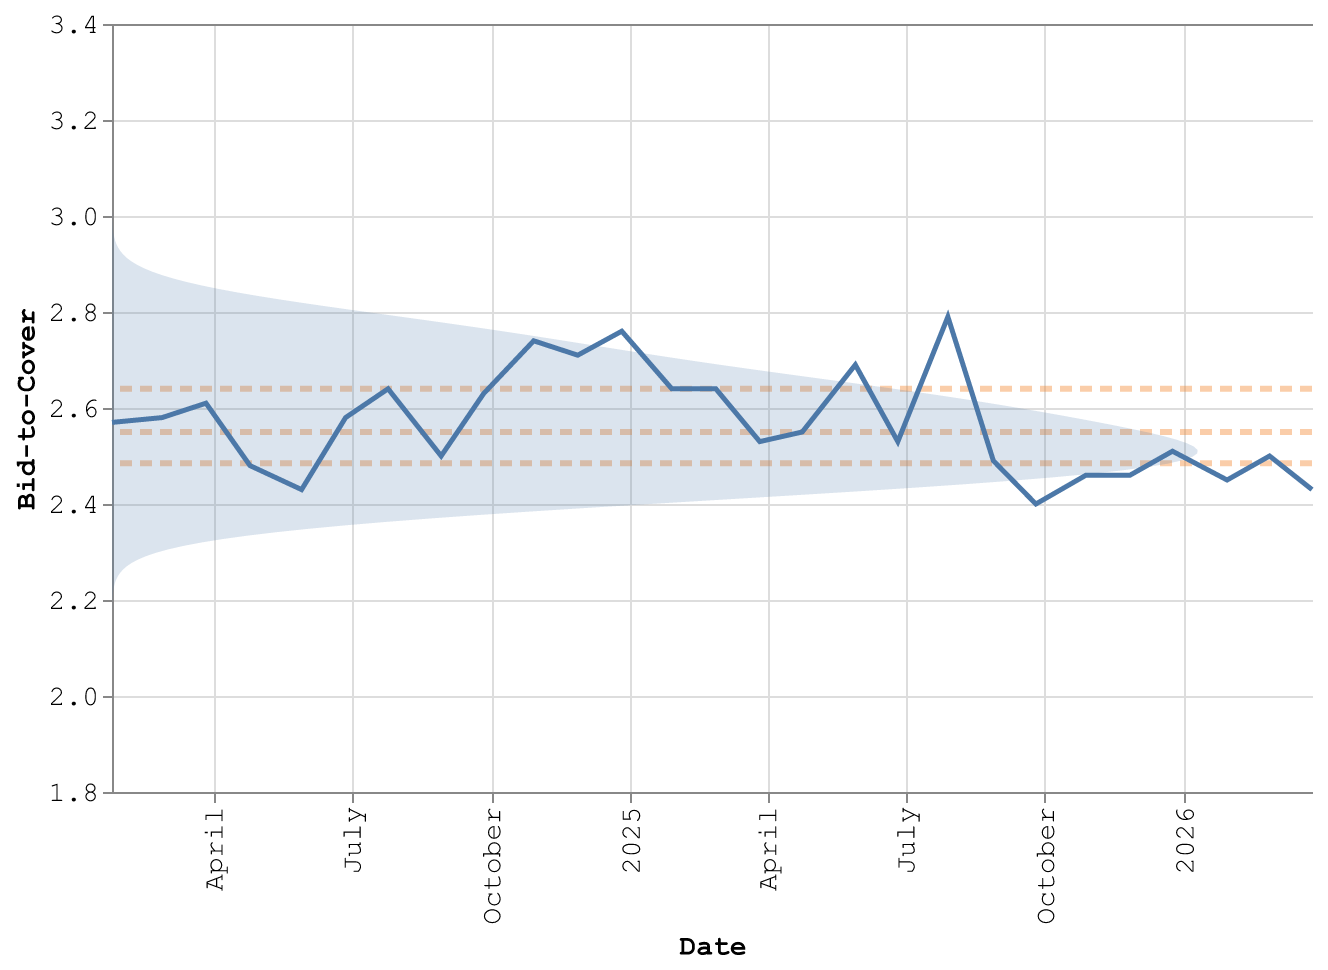
Figure 2: 7-Year Note bid-to-cover ratio since 2024. March 26 at 2.43x — below Q1, graded D.
Bid-to-cover divides total bids by the amount accepted. A ratio of 2.43x means \$2.43 in bids for every \$1.00 sold — below the first quartile of the 7-Year's historical distribution. The downward slope since 2024 is the real story. Each successive auction attracts fewer marginal bids relative to supply. War-driven uncertainty accelerated a decline already in progress.
Indirect Bidders: 62.6% (C-)
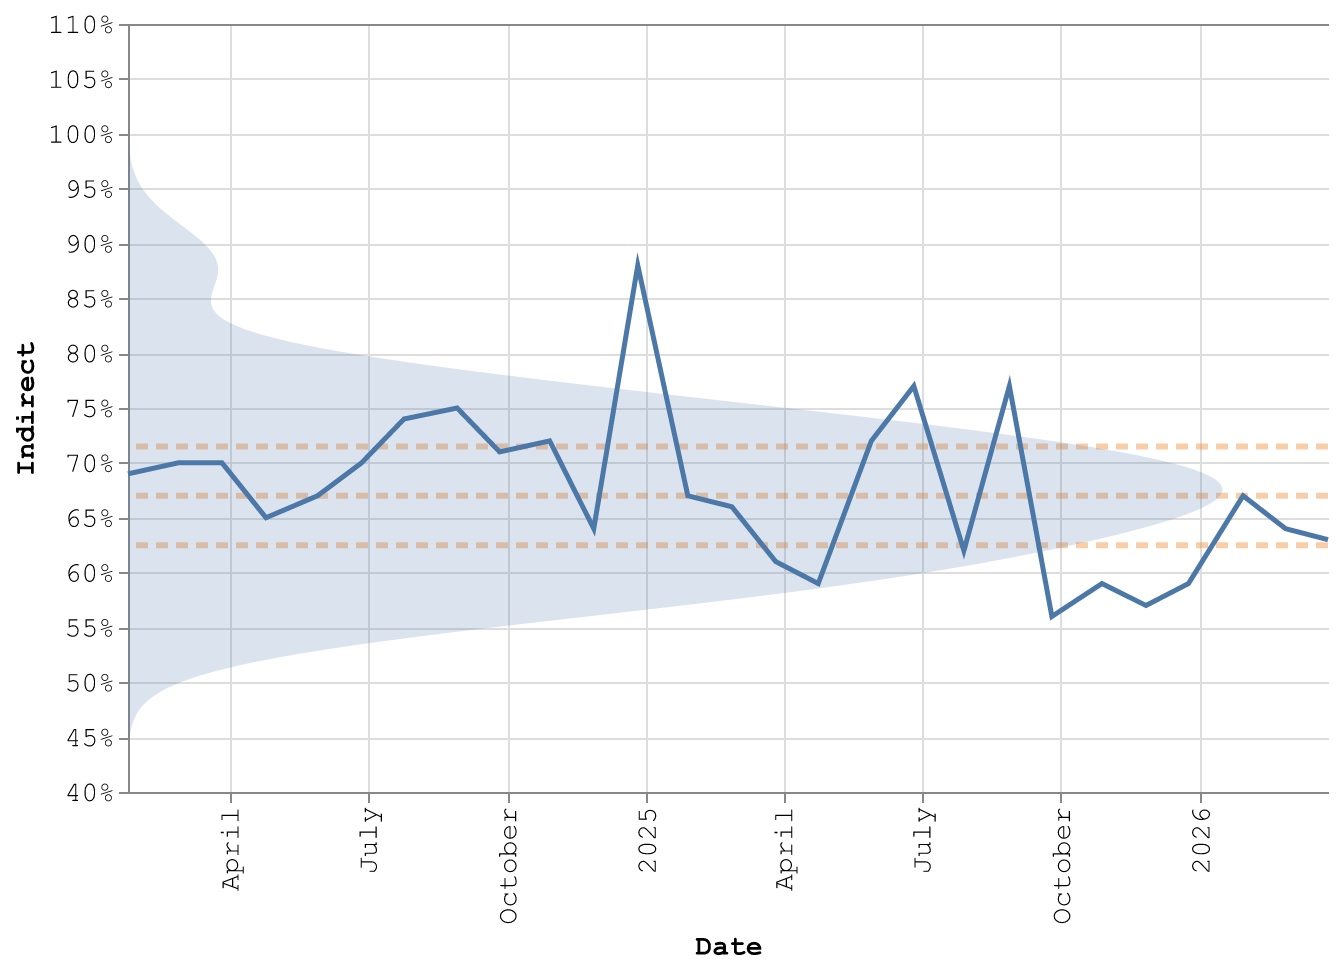
Figure 3: 7-Year Note indirect bidder participation since 2024. March 26 at 62.6% — below Q1, graded C-.
Indirect bidders — primarily foreign central banks and large institutional accounts — took 62.6% of the 7-Year, below the first quartile. Indirect participation oscillated near 70–75% through 2024, then slid in late 2025. The March 26 print continues that decline. When foreign buyers retreat from the 7-Year, the dealer community absorbs the difference. Dealers do not want duration risk in a war. They mark it wider and pass the cost to the next buyer.
Direct Bidders: 25.0% (C)
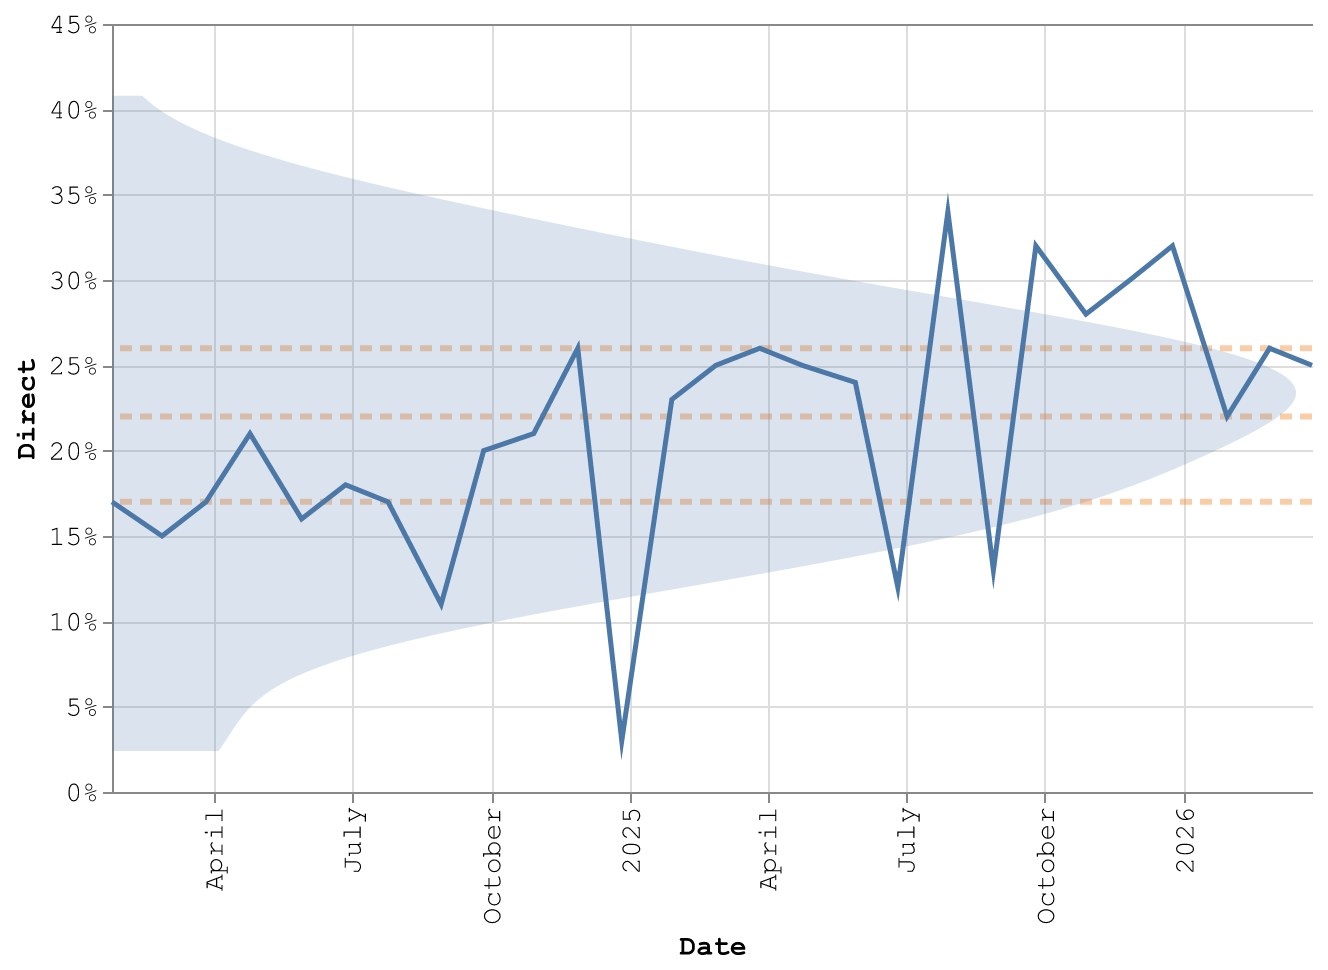
Figure 4: 7-Year Note direct bidder participation since 2024. March 26 at 25.0% — near the median, graded C.
Direct bidders — domestic institutions placing competitive bids without a dealer — took 25.0%, the one metric that held near the median. Domestic institutional demand did not collapse; it just did not compensate for the pullback in foreign demand and overall bid depth. The direct bid has swung between 12% and 35% since mid-2025. A near-median print during a crisis week suggests domestic accounts see value at 4.41%. They just did not see enough to lift the composite above D+.
What This Means
Three consecutive coupon auctions grading between D and C- is a regime signal. The market tells the Treasury three things:
Supply strains the system. \$183 billion in a single week, layered on \$200 billion in projected war funding, tests the absorption capacity of the primary dealer system. Every additional dollar of issuance competes for the same pool of risk-tolerant capital.
Foreign buyers reprice duration risk. Indirect participation declined across all three maturities this week. Oil above \$100 reshuffles reserve manager priorities. Central banks with energy import bills have less marginal capital for 7-Year Treasuries.
The sell-off is demand-driven, not narrative-driven. A +44 bps move in the 10-Year over five sessions might look like panic. The auction grades reveal something more specific: buyers are present, but at lower prices and in smaller quantities. Orderly repricing, not a rout — and that distinction matters for the Fed.
The auction calendar clears until next week. The structural decline in bid-to-cover ratios predates the war by months. These grades are not going back to B on their own.
Back
Sign in to leave a comment.
Comments (0)