Beating Your Cash ETF (Idle Cash Part 2)
Part 1 of this series ended suggesting that a small business, a startup, or a retail investor could manage idle cash almost as well as Apple's fixed-income desk in Reno using tools available to anyone.
Part 1 described five archetypes (from Apple's book to a stablecoin issuer holding more Treasuries than Germany) all focusing on the front of the Treasury curve. In this post we describe a simple sweep allocation that beats parking the money in a cash ETF. Once a month it ranks short-term T-bills, from 1 to 12 months, and allocates idle cash to the top-ranked tenor until the subsequent month. One decision, no trading desk, holding nothing but the safest government-backed securities.
We call this sweep allocation SweePro. A \$100,000 sleeve run by SweePro from mid-2007 would have grown to \$138,472 by the end of July 2026, net of fees. The same \$100,000 in BIL, the standard 1-3 month T-bill ETF, grew to \$129,881. About \$8,600 more over nineteen years, and SweePro took the shallower path: its worst drawdown was -0.20%, against -0.42% for BIL.
The track record
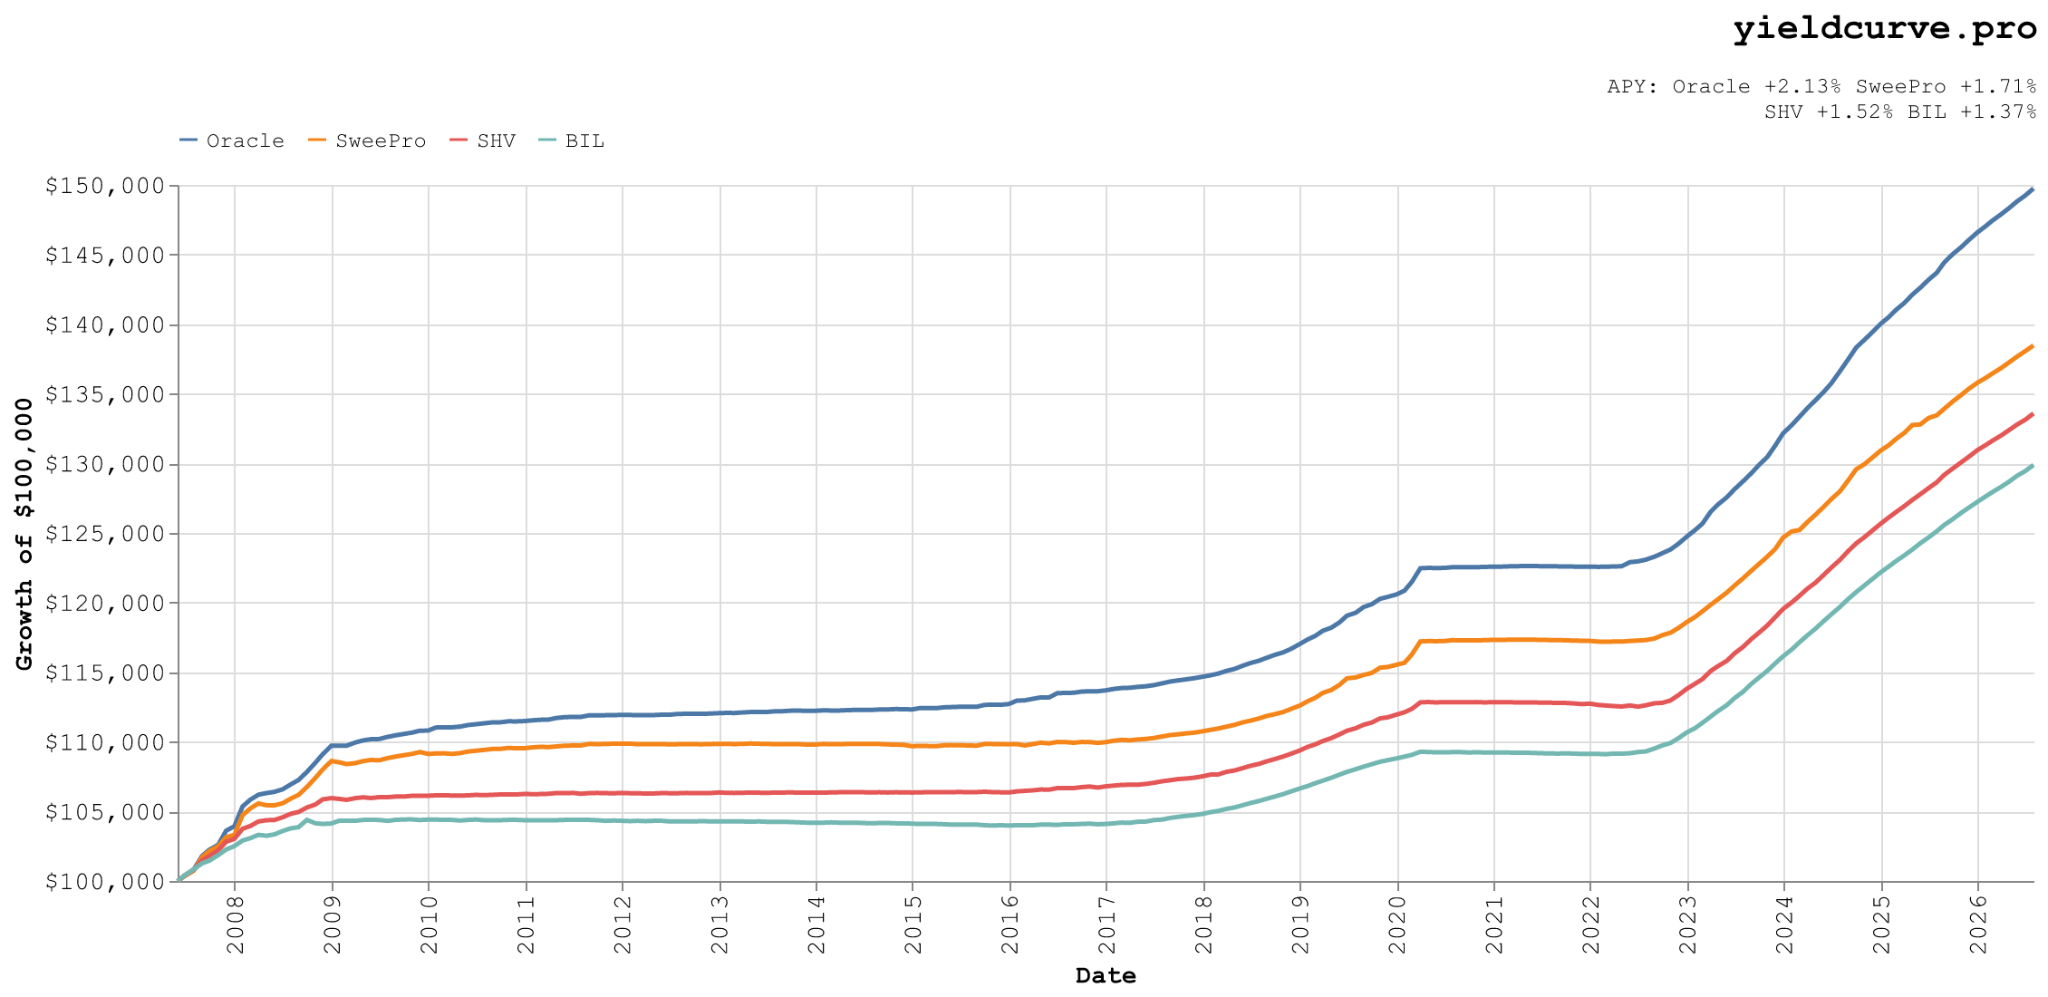
Figure 1: Growth of \$100,000 since 2007, net of fees. SweePro \$138,472, SHV \$133,582, BIL \$129,881, Oracle \$149,745 (as of July 31, 2026, updates monthly).
BIL and SHV are passive T-bill ETFs widely used for idle cash. Oracle picks the best tenor every month with perfect foresight and is not investable. It exists to measure the ceiling any tenor-selection rule can capture.
Over the timeframe June 2007 through July 2026, SweePro compounded at 1.71% per year relative to 1.37% for BIL, net of fees. The edge is +34 bps per year. That sounds small until you remember it is the front of the T-bill curve, where the entire dispersion across tenors is usually a handful of basis points, and that it compounds almost no drawdown.
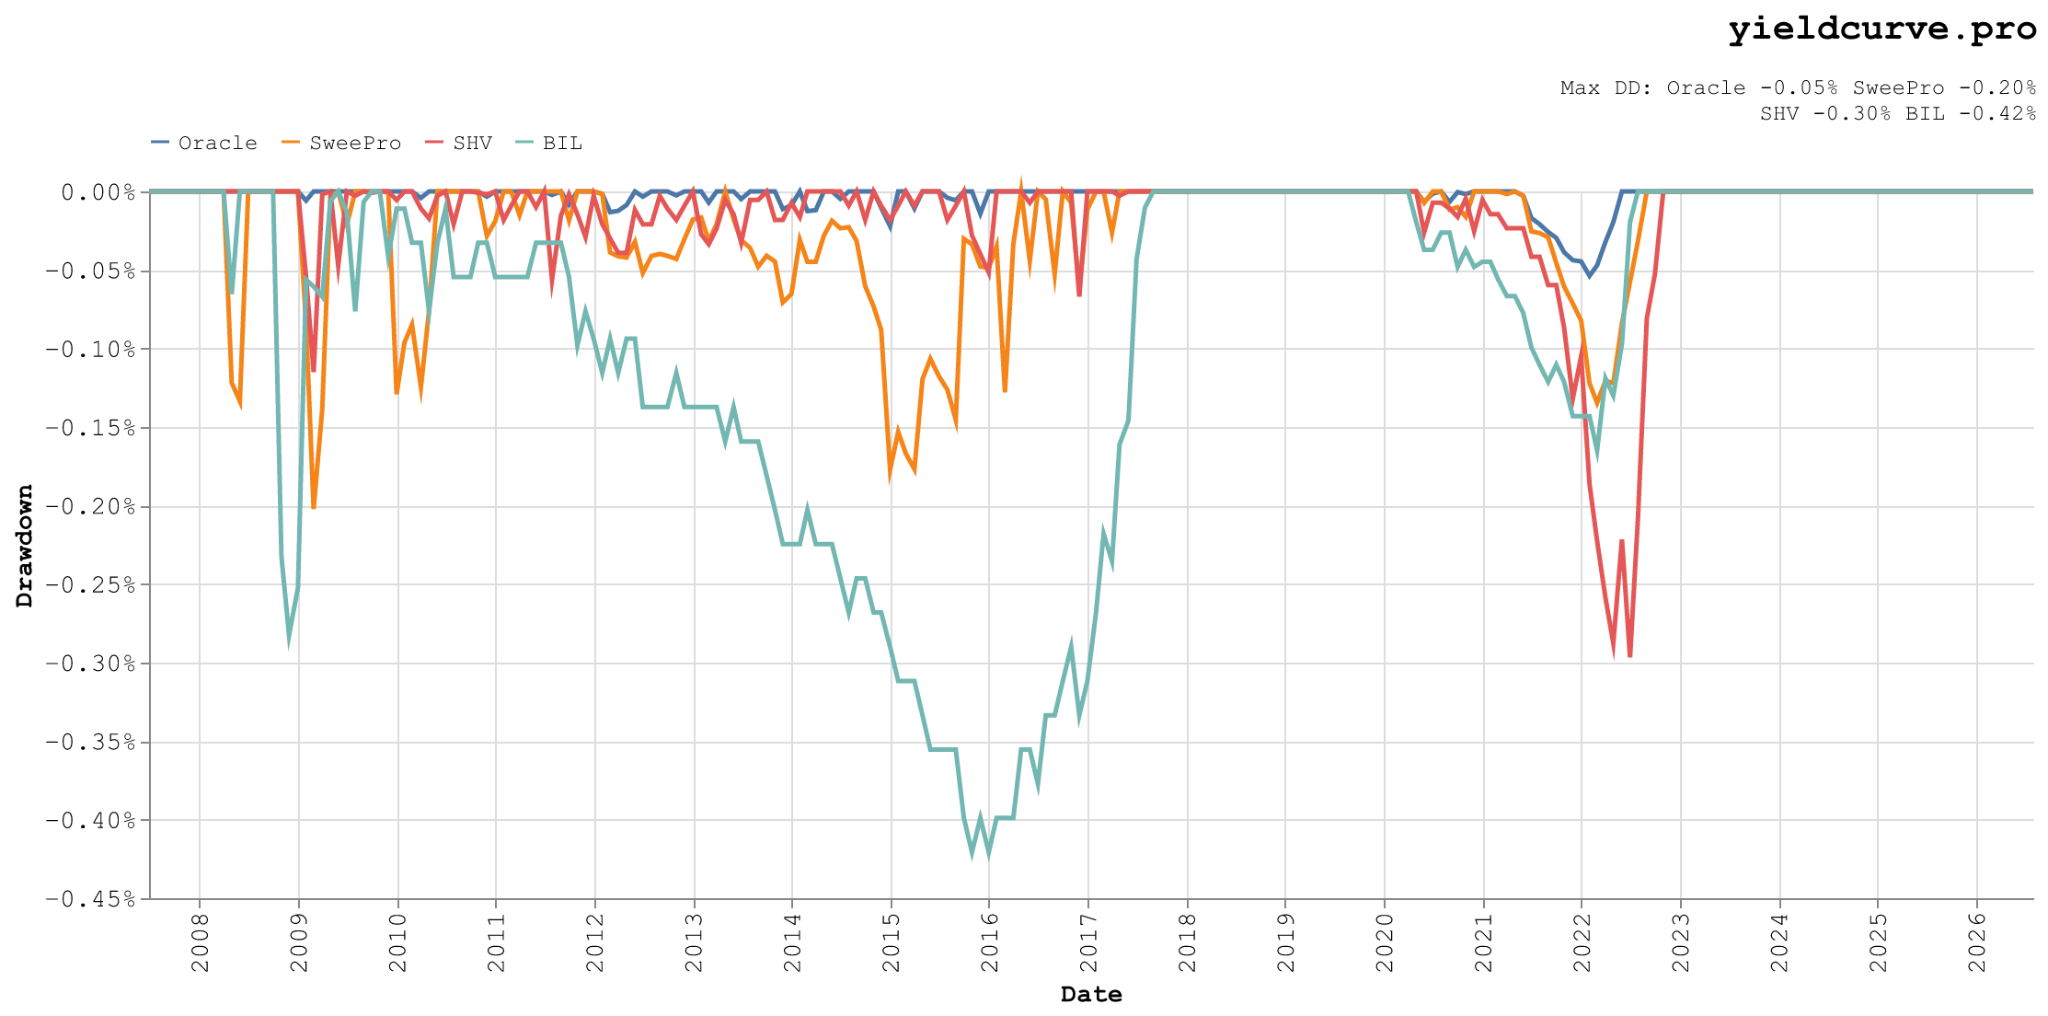
Figure 2: Drawdown. SweePro's worst peak-to-trough was -0.20% in February 2009, versus -0.42% for BIL in October 2015 (as of July 31, 2026).
The ceiling matters. Oracle, with perfect foresight, compounded at 2.13% per year. Its excess over BIL was +76 bps. SweePro captured 45% of that.
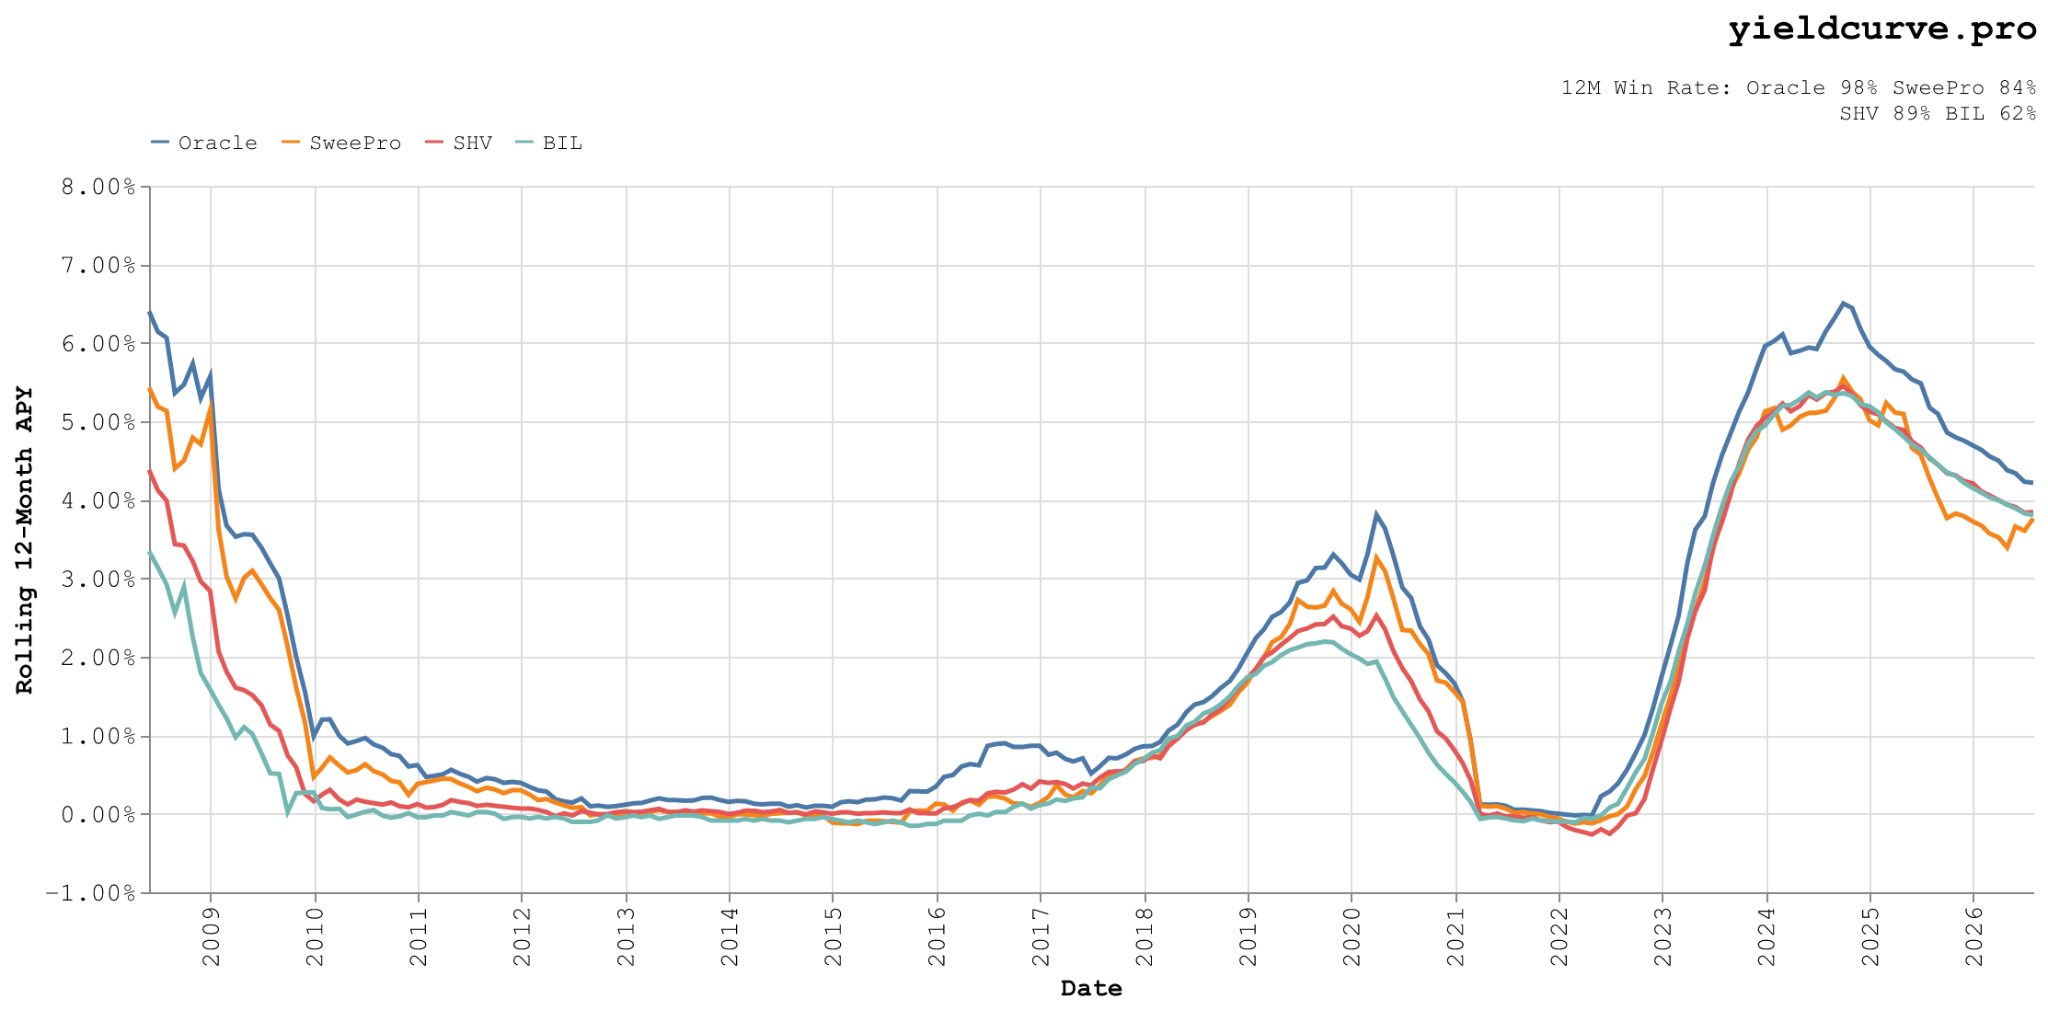
Figure 3: Rolling 12-month return. The edge arrives in bursts rather than as a steady monthly drip (as of July 31, 2026).
The rolling chart shows the shape of the edge, and it isn't a steady drip. In the 47 months when the front curve was steepest (i.e., the 1 Yr bill yielded more than the 1 Mo by over 40 bps at the start of the month), SweePro beat BIL by an average of 7.5 bps per month, more than four times the 1.6 bps edge in the other 183 months. That is exactly when picking the right tenor matters most, and it is where the ranking earns its keep.
The catch
Running this yourself is one decision a month. At the start of the month check whether what you hold matches the current tenor. If it does, you're done. If not, roll to the new one.
What nobody tells you is the rest of it. How does a small systematic shop trade individual tenor T-bills and roll them if necessary? Hint: it's not Treasury Direct. Part 3 in the series walks through the operational mechanics end to end.
DISCLAIMER: All results shown above are hypothetical and simulated prior to SweePro's first live allocation in June 2026. See our Terms of Service for full disclosures.


Back
Sign in to leave a comment.
Comments (0)