Your Biggest Asset Isn't in Your Portfolio
A 30-year-old software engineer earning \$120k with \$50k in a 401(k) has a problem. Every target-date fund and financial advisor will tell her to hold 80–90% equities because she's young. None of them can explain why — except to gesture vaguely at time horizons.
The answer is human capital. Her future income — decades of paychecks, discounted back to today — is worth far more than her savings account. That income stream behaves like a bond: it arrives in regular installments, it's partially inflation-protected, and it doesn't track equity returns. She already owns a massive bond position. She just can't see it on her brokerage statement.
That insight drives the lifecycle portfolio calculator on yieldcurve.pro. It comes from a 2025 paper by Choi, Liu, and Liu that makes Robert Merton's 1969 lifecycle model usable for practitioners — which we review on the papers page.
The Paper
Choi, Liu & Liu (2025), "Practical Finance: An Approximate Solution to Lifecycle Portfolio Choice" solves a decades-old problem in financial economics. Merton's continuous-time portfolio model produces a clean result: hold a constant fraction of wealth in equities, set by the equity premium, volatility, and risk aversion. But the model assumes all wealth is investable — it ignores that most people's largest asset is future labor income.
Add labor income and the math becomes intractable. The state space explodes. Numerical solutions exist but require PhD-level computation and offer little intuition. CLL contribute an analytic approximation — closed-form equations calibrated by regression against the full numerical solution. It matches the exact answer to within a few percentage points across realistic parameter ranges.
Why It Matters
The advice industry runs on rules of thumb. "100 minus your age" in equities. Target-date funds with arbitrary glide paths. These rules share a defect: they're calibrated to nothing. They don't account for income level, education, risk tolerance, or the economic environment.
CLL quantified the cost:
- CLL approximation: 0.06% welfare loss
- 100 minus age: 2.00%
- Constant 60/40: 3.75%
- All bonds: 7.86%
- All stocks: 11.85%
The approximation is 33x cheaper than the most popular rule of thumb and 62x cheaper than a static 60/40.
Young workers should hold more equity than they think. A 25-year-old with \$30k in savings and \$70k in income has a human capital value north of \$1 million. Her total wealth is overwhelmingly bond-like. An all-equity financial portfolio barely gets her total allocation to the Merton optimal. As Choi put it on the Rational Reminder podcast: "You have this huge bond-like asset in your implicit portfolio. You should not be afraid of putting that money into stocks."
The glide path isn't linear. Unlike "100 minus age," the CLL path curves. It stays high longer — human capital depletes slowly in early career, especially for college graduates whose income peaks later — then drops steeply as retirement approaches and the bond-like asset vanishes.
Education affects risk in counterintuitive ways. High school dropouts face high transitory income risk (temporary layoffs, seasonal work) but low permanent risk (career trajectories are flatter). College graduates face the opposite: low transitory risk but high permanent risk (promotion failures, industry disruption). Permanent income risk suppresses equity allocations — transitory shocks wash out. Controlling for other factors, less-educated workers can rationally hold more aggressive portfolios than college graduates, not less.
The Calculator
yieldcurve.pro now has a lifecycle portfolio calculator that implements the CLL approximation with six inputs: age, income, savings, retirement age, education level, and risk tolerance. Two advanced parameters — equity premium and real risk-free rate — default to 4% and 1%.
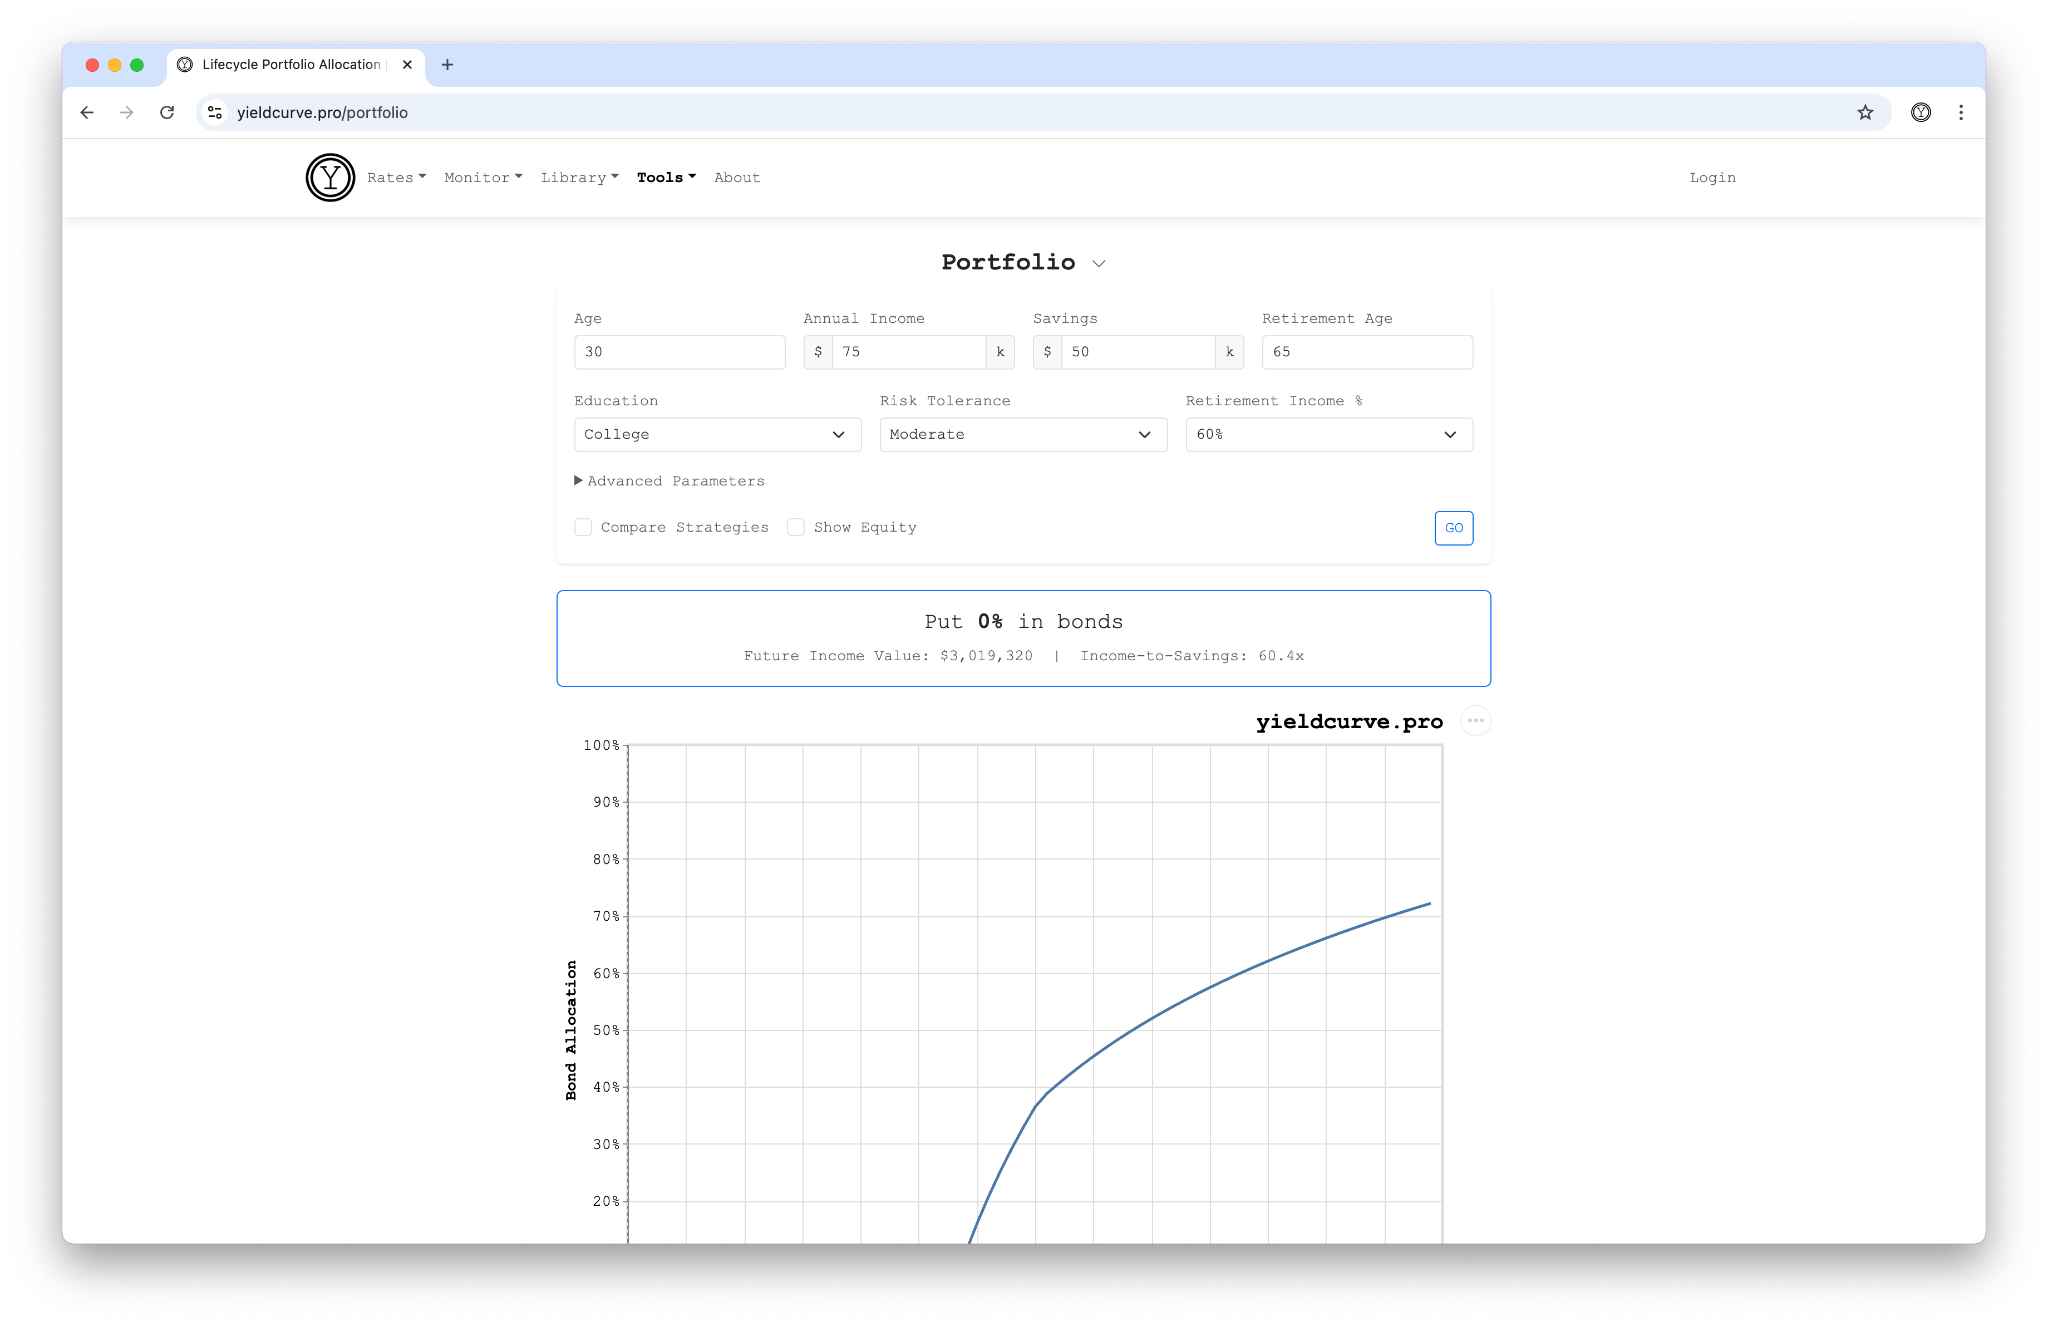 Figure 1: The lifecycle portfolio calculator with sample inputs and allocation path.
Under the hood:
-
Income projection. A cubic polynomial in age, calibrated by education level, projects the income trajectory. The polynomial anchors to your current income, so it adapts to your situation, not an average.
-
Human capital valuation. Future income discounted year by year using the CLL regression equations. Pre-retirement uses one set of coefficients; post-retirement (Social Security income at your specified replacement rate) uses another. The discount rate incorporates risk aversion, the equity premium, income volatility, and age.
-
Allocation path. The calculator simulates forward from your current age to 99, computing optimal equity allocation each year. Wealth grows at portfolio returns, with a 15% savings rate during working years.
-
Strategy comparison. Toggle "Compare Strategies" to overlay four alternatives: 60/40, the Age Rule (100 − age), All Stocks, and All Bonds. The CLL recommendation draws with heavier stroke weight; alternatives are dashed.
The Bond Perspective
CLL express their results as an equity share — the fraction of financial wealth in stocks. That's the natural convention for an asset pricing paper: the risky asset is what you study, and the riskless asset is the residual.
The calculator flips this. By default it shows "Put X% in bonds," not equities. The site is called yieldcurve.pro after all. Every other tool here — curves, slopes, forwards, term premia — frames the world from the fixed-income side.
The flip clarifies the model's central mechanism. You already own a giant bond — your human capital. The question the theory answers isn't "how much equity should I add?" but "given the bond I already own, how much more bond exposure do I need in my financial portfolio?" For most young workers: very little. Human capital is the bond allocation. The financial portfolio provides the equity exposure that human capital doesn't.
When the calculator says "Put 15% in bonds," you see the gap between your human capital bond and the total bond allocation the theory prescribes. When it says "Put 60% in bonds," you're approaching retirement and replacing the bond-like asset that's disappearing.
Flip to equity view with the "Show Equity" toggle. Same allocation, different lens.
Limitations
The calculator assumes a single risky asset (equities) and a single riskless asset (bonds). It ignores housing, pensions, stock options, and other illiquid assets. It omits the correlated income extension, where permanent income shocks co-move with stock returns. It sets survival probabilities to 1.0, slightly overstating human capital at older ages.
The equity premium and risk-free rate inputs have outsized influence on the result. Small changes in these assumptions shift the allocation. Good. You must state your beliefs about expected returns, not hide them in a target-date fund's black box.
Read our review of the paper. Then run the calculator.
Further Reading
- Choi, Liu & Liu (2025) — "Practical Finance: An Approximate Solution to Lifecycle Portfolio Choice" (SSRN)
- Rational Reminder Ep. 399 — Prof. James Choi: Portfolio Theory in a Spreadsheet
- Merton's Portfolio Problem (Wikipedia)
FAQ
What is human capital in portfolio theory?
Human capital is the present value of all future labor income, discounted to today's dollars. For a young earner with decades of paychecks ahead, human capital typically dwarfs financial savings and behaves like a long-duration, partially inflation-linked bond. Lifecycle portfolio theory treats it as an off-balance-sheet asset that should reduce demand for explicit bond holdings.
How does Merton's lifecycle model differ from rule-of-thumb glide paths?
Merton's 1969 continuous-time model derives optimal equity allocation from the equity premium, return volatility, and risk aversion, holding equity share constant when all wealth is investable. Adding human capital makes the math intractable in closed form, which is why target-date funds have historically used age-based heuristics instead. Lifecycle theory rejects rules like "equity share equals 110 minus age" as having no theoretical foundation.
What did Choi, Liu and Liu (2025) contribute to lifecycle portfolio choice?
They derive a closed-form approximation to Merton's model that includes human capital, calibrated by regression against the full numerical solution. The approximation makes the optimal glide path computable in a spreadsheet rather than requiring PhD-level numerical methods. This is the engine behind the lifecycle calculator on yieldcurve.pro.
Why should equity allocation typically decline with age?
Human capital depletes as the worker ages, so the implicit bond component of total wealth shrinks. To maintain a stable total risk profile, financial wealth must hold more bonds and fewer equities over time. The decline is driven by the human-capital math, not by any presumed link between age and risk tolerance.
Back
Sign in to leave a comment.
Comments (0)