Prediction Markets Meet the Yield Curve
Prediction markets now forecast Treasury yields with a track record that embarrasses the sell side. YCP's new Odds page puts those probabilities next to the yield curve data you already use — no tab-switching required.
What the Odds Page Shows
The page aggregates live prediction market data from two venues — Kalshi and Polymarket — across three categories:
- Levels: Bracket markets on the 10Y daily and weekly yield, quarterly par yields for the 2Y, 5Y, 10Y, and 30Y, and 3-month T-bill yields.
- Slopes: Threshold markets on the 10Y−2Y and 10Y−3M spreads — the two curve measures that drive most regime calls.
- Fed Funds: FOMC meeting outcome markets pricing cuts, holds, and hikes.
Each market card displays outcome labels, implied probabilities as percentages with visual progress bars, and total contract volume. Click through to a detail page and the market sits alongside an embedded yield or spread chart covering the trailing year — so you can compare what the market expects against what the curve has done.
Data refreshes every five minutes. Markets sort by tenor and volume, putting the most liquid contracts first.
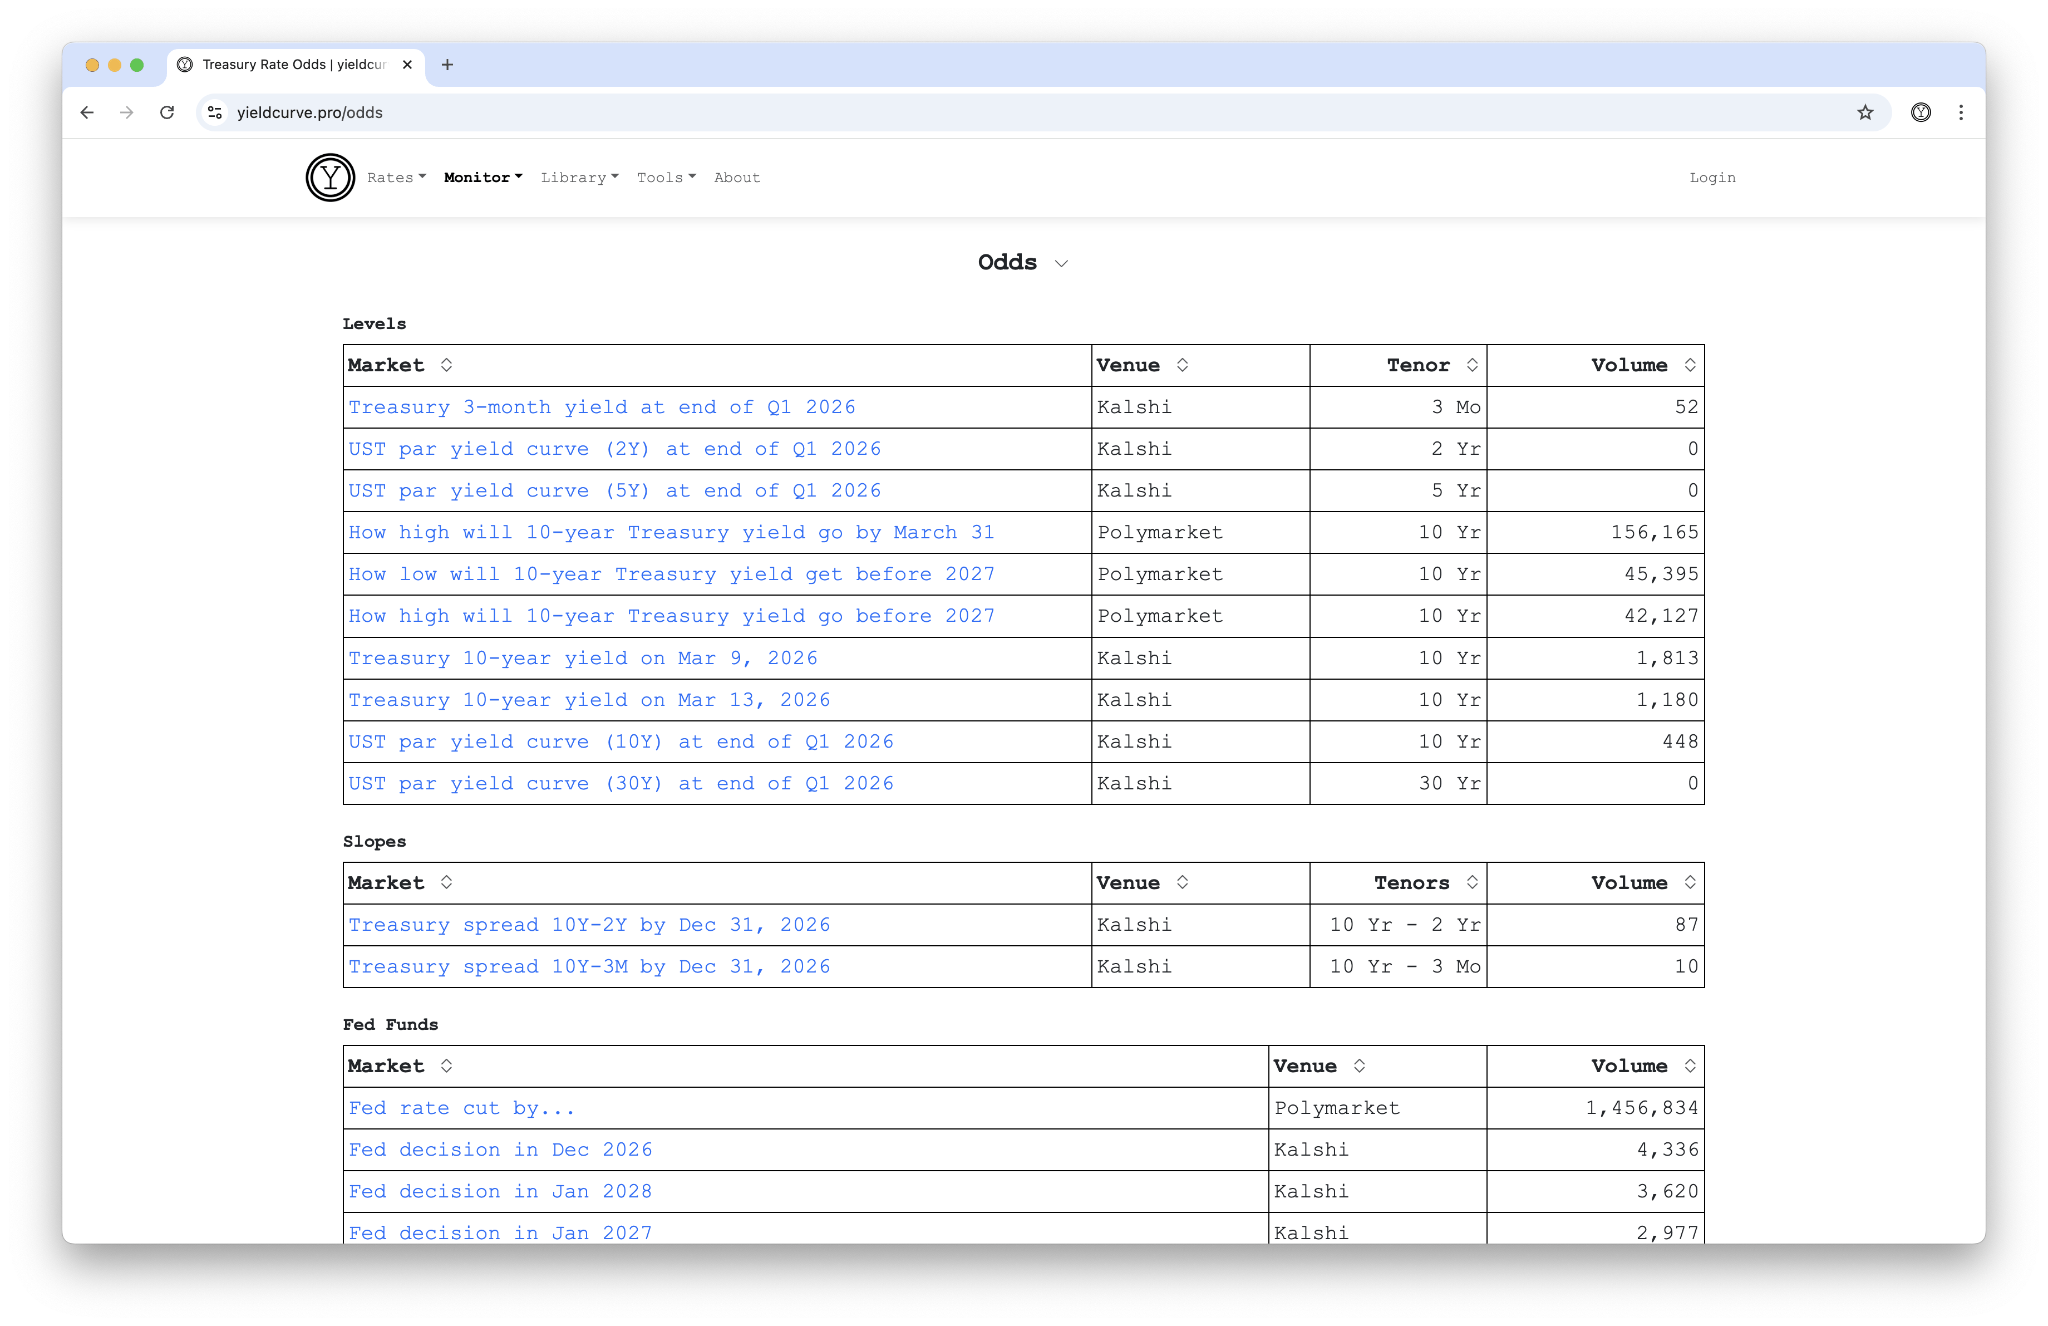 Figure 1: The Odds landing page — prediction markets grouped by Levels, Slopes, and Fed Funds.
Why Prediction Markets Deserve a Seat at the Table
An NBER working paper by Diercks, Katz, and Wright gave prediction markets a rigorous benchmark test — and the results are hard to dismiss. The modal Kalshi forecast for FOMC decisions has maintained a perfect track record from 2022 through mid-2026. In September 2024, when professional forecasters split on the magnitude, Kalshi traders correctly priced a 50 bp cut.
The advantage is structural. The New York Fed's Survey of Primary Dealers runs every six weeks. Bloomberg consensus updates on a similar cadence. Kalshi prices move in seconds. As Katz put it: predictions "react instantly to news, or at a much higher click to news, than waiting six weeks for the next survey." The prediction market industry has grown from \$300 million to \$40–\$50 billion since August 2025 — that volume carries information.
Beyond the Fed, the paper finds Kalshi's headline CPI forecasts run a mean absolute error of 6.3 bps versus 8.1 bps for Bloomberg consensus. Inflation and unemployment forecasts match or beat institutional surveys. A separate Kalshi-authored study reported 40.1% lower MAE on inflation shock forecasts relative to consensus.
Connecting the Data
We reviewed the underlying research in detail on our paper review of Diercks, Katz & Wright. The paper validates 13 macro contract series on Kalshi — fed funds, CPI, unemployment, GDP, nonfarm payrolls — benchmarked against the FRBNY Survey of Market Expectations, Bloomberg consensus, and fed funds futures. The key finding for rates practitioners: prediction markets deliver distributional information, not just point estimates. You see the full probability surface, not a single median.
The Odds page operationalizes that insight. Instead of toggling between Kalshi's website, Polymarket, and your yield curve charts, the data sits in one place. A 10Y yield bracket market next to the actual 10Y chart. A 10Y−2Y spread market next to the spread history. The juxtaposition makes regime analysis faster — when prediction markets price a steepening and the curve confirms it, the signal compounds.
What It Means for Duration Positioning
Prediction market probabilities carry a caveat: they reflect consensus, not forecasts. Risk premia and retail participation can skew prices. The NBER paper acknowledges the short sample (2022–2026) and flags that Kalshi's retail-heavy base may behave differently from institutional flow.
Those caveats acknowledged, the tool sharpens one specific workflow: comparing your rate view against the market's. If you hold a duration overweight and Kalshi prices the 10Y above your target with 60% probability, you know where the crowd sits. If the spread markets price an inversion and your regime model calls a steepening — that disagreement is worth investigating.
The Odds page updates regularly alongside the rest of YCP's yield curve data. Use it as a complement, not a substitute, for your own analysis.
Back
Sign in to leave a comment.
Comments (0)