What a Treasury Fund's Yield Tells You About Its Return
A bond fund's yield is the conventional forecast of its return. The forecast is most accurate over a holding period of about twice the fund's duration and less accurate over shorter periods. On Treasury data the error is about 0.8 percentage points a year even at the best horizon. The error keeps the same sign for one to nine years at a time. This post measures the pattern on Treasury data and turns it into four rules.
The data
The yields are Treasury constant maturity series from FRED, monthly averages for the 3 Yr, 5 Yr, 7 Yr and 10 Yr bonds from July 1969 through August 2026. That is 686 months. The 7 Yr series starts last, in July 1969, so the sample for every tenor begins there. The 20 Yr has no data from 1987 to 1993 and is left out.
FRED publishes yields, not returns, so we calculate the returns ourselves. Each month we buy a bond at par at that month's yield. One month later we sell it at the new yield. By then it is one month closer to maturity. We use the proceeds to buy a new bond at par. We compound the monthly returns and annualize. Everything that follows tests this rolling portfolio, which mimics the structure of a fund, and not an individual bond held to maturity. A bond fund that holds a constant maturity does something similar, so the result is close to what a fund holder earned before fees. As a check, we compared our 10 Yr series with the annual Treasury bond returns published by Aswath Damodaran, a finance professor at NYU Stern, and the two correlate at 0.99.
Starting yield is the yield in the month you buy. Forward return is the annualized return over the years you hold. Forecast error is forward return minus starting yield, so a negative number means you earned less than the yield promised.
Testing the forecast
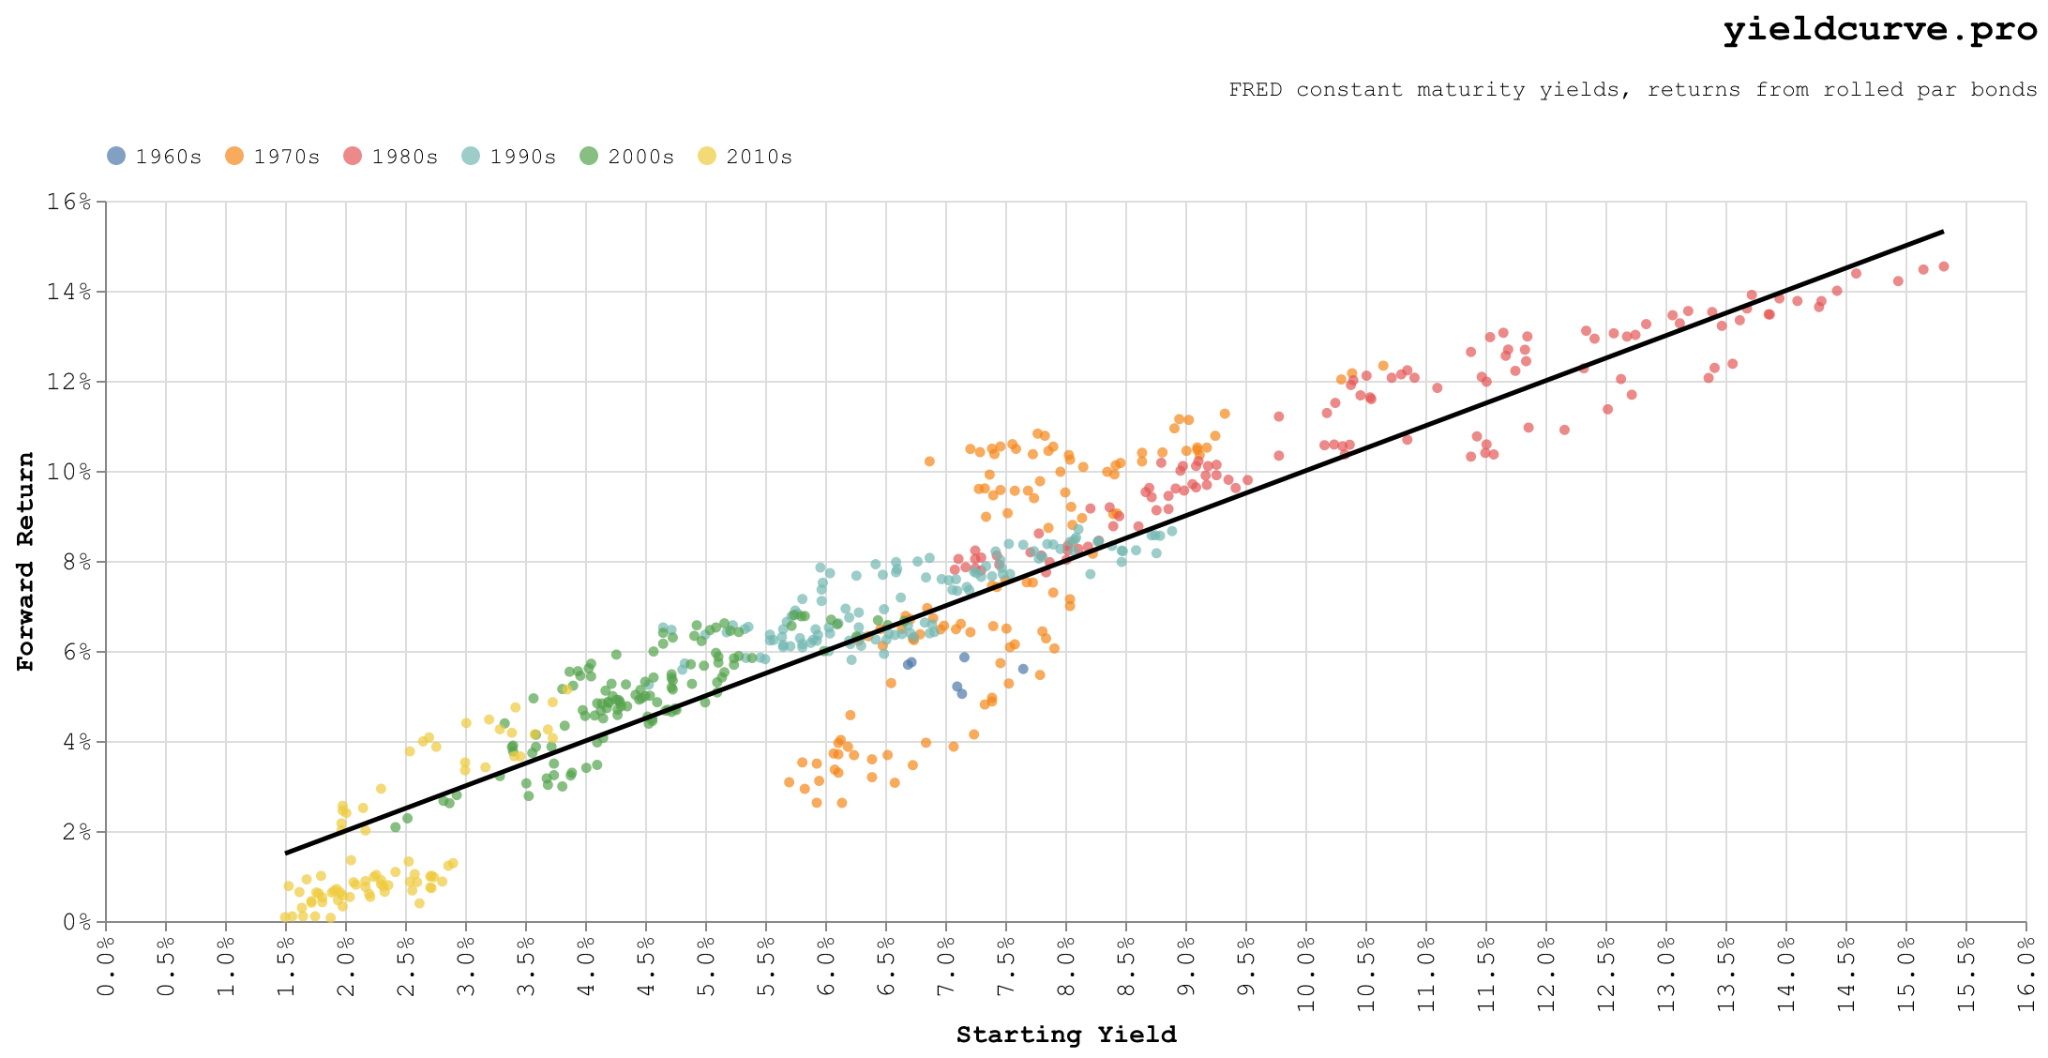
Figure 1: 10 Yr starting yield against the annualized return over the following ten years, one point per purchase month from 1969 to 2016, colored by decade.
Figure 1 plots the 10 Yr yield at purchase against the annualized return over the ten years that followed. The correlation is 0.94. Grouped by year of purchase, the points separate into runs. Buyers from 1970 to 1974, who bought before rates rose, lie below the line in 95% of months. Buyers from 1975 to 1979 lie above it in 97% of months. Buyers in the 1980s, 1990s and 2000s lie above it in about three quarters of months. Buyers from 2012 to 2016, who bought under 3% and held through the rate rises of 2022, lie below it in 96% of months. Within each decade from the 1970s on, the correlation runs from 0.78 to 0.95. The spread of yields across decades, from 1.5% to 15.3%, accounts for most of the overall correlation of 0.94.
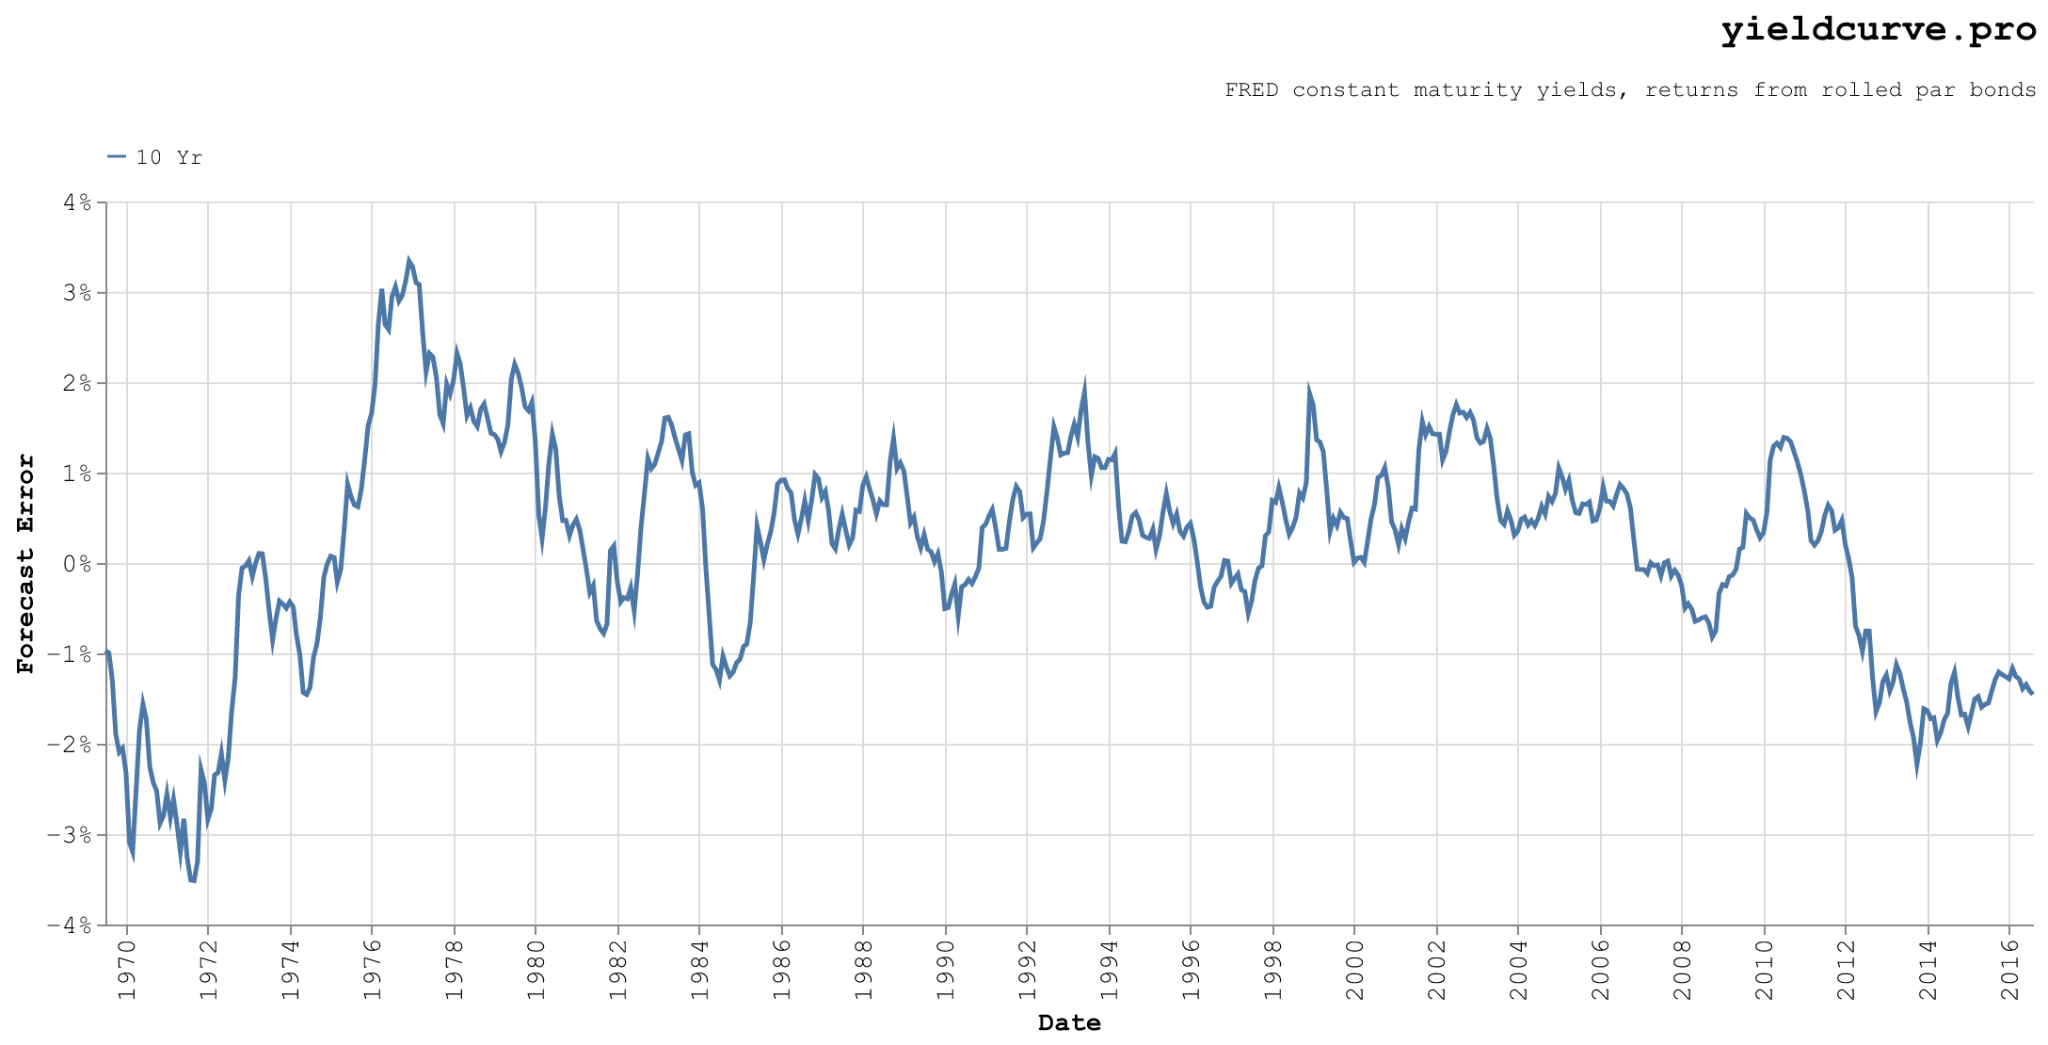
Figure 2: Forecast error for the 10 Yr over a ten year holding period, by purchase date.
Figure 2 plots the forecast error from the same windows against the purchase date. The error is not random. It keeps the same sign for runs of one to nine years, and the longest run, from November 1997 to November 2006, lasted 109 months. A buyer in September 1971 bought at 6.14% and earned 2.62% a year over the next ten years, an error of -3.52%. A buyer in December 1976 bought at 6.87% and earned 10.21%, an error of +3.34%. Buyers in 2013 bought at an average yield of 2.35% with an average error of -1.56%. The mean absolute error over the whole sample is 0.96% a year, but that average rests on only four separate ten year episodes.
The right holding period is twice the duration
Ten years is the conventional pairing for a 10 Yr fund but it is not optimal. A better pairing follows from a result that Martin Leibowitz and Anthony Bova set out in 2012 and that Leibowitz, Bova and Stanley Kogelman summarized in the Financial Analysts Journal in 2014. A fund that keeps its duration constant at D years sees its annualized return converge to its starting yield after about 2D - 1 years. This post refers to that span as the convergence horizon.
A fund never matures, so a change in yields affects it twice. It changes the price immediately and the reinvestment income in every year that follows. Suppose yields change by the same amount every year. Each year's return then equals the starting yield plus that annual change multiplied by the difference between the years elapsed and D. Returns run below the starting yield for the first D years and above it afterward, and the average equals the starting yield after 2D - 1 years. Gabriel Lozada's 2016 paper gives the derivation in full. An individual bond behaves differently. If you hold it for a period equal to its duration, it earns about its starting yield. That result goes back to Hicks and Macaulay. If you hold it to maturity, you get the principal back whatever rates do.
The data agree. The table shows each rolled bond's average duration over the sample, the convergence horizon that duration implies, and the holding period with the smallest forecast error.
| Tenor | Duration | 2D - 1 | Smallest error at | Mean absolute error | Correlation | Independent windows |
|---|---|---|---|---|---|---|
| 3 Yr | 2.7 | 4.5 | 4 years | 0.84% | 0.96 | 13 |
| 5 Yr | 4.3 | 7.7 | 8 years | 0.82% | 0.95 | 6 |
| 7 Yr | 5.7 | 10.5 | 10 years | 0.82% | 0.94 | 4 |
| 10 Yr | 7.6 | 14.1 | 13 years | 0.81% | 0.94 | 3 |
Table 1: Average duration of each rolled bond over the sample, the convergence horizon 2D - 1 that duration implies, the holding period with the smallest mean absolute forecast error, and the correlation and number of non-overlapping windows at that holding period.
Every tenor's best holding period is within about a year of 2D - 1, and the error at that point is about 0.8% a year. The last column counts the non-overlapping windows, which is the number of independent tests. For the 10 Yr held thirteen years that number is three.
Shorten the holding period and the forecast weakens. The 10 Yr held one year has a correlation of 0.52 with its starting yield and a mean absolute error of 6.21%, so the yield explains about a quarter of the variation in one year returns. The 3 Yr held one year has a correlation of 0.79 and a mean absolute error of 2.49%. The 10 Yr does not reach 0.90 until year seven. Javier Estrada's The Expected Return of Bonds (2025) finds the same gradient on Shiller's data from 1871, with the correlation rising from 0.55 at one year to 0.96 at ten to fifteen.
Four rules
Choose your holding period, derive the duration, then pick the fund. Call the holding period H. The duration to look for is D = (H + 1) / 2. Choose the fund whose published duration is closest to D. A four year horizon implies a duration near 2.5. The 3 Yr bond, or a fund with a similar duration, matches it. IEI at 4.2 and IEF at 6.9 do not. Buying the longer fund for its higher yield means taking interest rate risk you did not intend to take.
If you need the yield to be your return, own the bond, not the fund. A fund is a rolling portfolio, and the errors in Figure 2 are the cost of never maturing. An investor who bought the 10 Yr bond in September 1971 and held it to September 1981, reinvesting coupons at the 1 Yr rate, earned 6.93% a year. The rolling portfolio bought the same month earned 2.62%. The 1976 buyer shows the reverse. The bond held to maturity earned 7.77% while the rolling portfolio earned 10.21%. The 10 Yr yield rose from 6.87% to 15.32% by September 1981 and then fell to 7.11% by December 1986, so the rolling portfolio reinvested at higher yields on the way up and gained in price on the way down. Holding to maturity gives up the windfall and avoids the shortfall. Defined maturity ETFs, such as the iShares iBonds Term Treasury series, do the same in fund form because they mature on a set date.
Plan on the SEC yield and stress test three and a half points below it. The forecast carries no bias. At the best horizon the mean error is within 0.2% of zero for every tenor, so there is nothing to add or subtract. The worst ten year error for the 10 Yr was -3.52% a year, and it came from one purchase date followed by a decade in which every year but one returned less than the yield. That decade is the stress case for a retirement projection.
Do not expect returns above the yield. Most points above the line in Figure 1, 88% of them, belong to buyers whose ten years ended with a lower 10 Yr yield than they started. The claim that returns will beat the yield because yields are the highest in fifteen years assumes the decline in rates from 1981 to 2020 will repeat. The yield is the expectation. Anything beyond it requires rates to fall again, and the yield says nothing about whether they will.
The rules applied to three funds
The figures below come from iShares as of September 22, 2026. We match each fund to the Treasury bond with the nearest duration and show that bond's error at its best horizon.
| Fund | Duration | 2D - 1 | Yield to maturity | 30 day SEC yield | Nearest bond | Typical error |
|---|---|---|---|---|---|---|
| IEI | 4.22 | 7.4 years | 4.84% | 4.56% | 5 Yr | 0.82% |
| IEF | 6.89 | 12.8 years | 4.93% | 4.73% | 10 Yr | 0.81% |
| AGG | 5.74 | 10.5 years | 5.27% | 4.86% | 7 Yr | 0.82% |
Table 2: iShares fund data as of September 22, 2026, the convergence horizon each fund's duration implies, the Treasury bond with the nearest duration, and that bond's mean absolute error at its best holding period.
Hold IEI for seven to eight years and plan on 4.6% to 4.8%, with a typical error of 0.8% a year. IEF implies a thirteen year holding period at its current duration. Rule one says to compare that span with your own horizon before buying it for the yield. AGG does not fit the framework. It holds 47% Treasury, 23% mortgage pass-throughs and 25% corporate bonds, and the mortgage share prepays when rates fall, so the Treasury numbers are a lower bound on its error. Estrada (2025) puts the Bloomberg US Aggregate's correlation over 2000 to 2024 at 0.79 over its duration and 0.87 at ten years, against 0.95 for the 5 Yr Treasury here.
Prior research and caveats
The result is not new. John Bogle called the starting yield the single most important factor in bond returns in 1991, and in 1995 he reported a 0.95 correlation between long Treasury yields and the ten year returns that followed over 1926 to 1990. Leibowitz, Bova and Kogelman's 2014 paper supplies the convergence horizon and shows that the convergence holds whatever path rates take. Gabriel Lozada's Constant-Duration Bond Portfolios' Initial (Rolling) Yield Forecasts Return Best at Twice Duration (2016) gives the derivation and six decades of evidence. Estrada's paper also covers six Bloomberg indices from 2000 to 2024. His three US indices, with durations of 5.5 to 6.9, peak over ten to twelve years, which matches 2D - 1, though he does not use the term. His three global indices peak closer to their duration, so the rule is not universal.
Four caveats apply. The returns come from monthly average yields, not fund prices, and carry no expense ratio, while IEI and IEF each charge 0.15%. The windows overlap, so the correlations look more certain than a handful of independent trials can justify. The 2D - 1 result assumes yields drift in a straight line, and Lozada shows the sign of the error depends on how the path bends. Everything is nominal. The 1971 buyer's 2.62% was a loss after inflation, which ran 8.6% a year over that decade.


Back
Sign in to leave a comment.
Comments (0)