VIX and MOVE Describe Market Stress but Do Not Predict It
Implied volatility is the size of the price moves that option prices expect over the coming month. In September, Treasury implied volatility rose and stock implied volatility did not. On September 29, the MOVE index of Treasury implied volatility closed at 106.6, up 50% in a month. The VIX, its counterpart for stocks, closed at 16.0. Some market commentary treats a rise in MOVE without a rise in the VIX as a warning for stocks. We tested that view against 24 years of daily data. The comparison shows where stress comes from. It predicts very little.
What each index measures
The VIX measures the 30-day implied volatility of S&P 500 options. It is quoted in percent of price, annualized. The MOVE index uses one-month at-the-money options on the 2, 5, 10 and 30 Yr Treasuries, weighted 20%, 20%, 40% and 20%. MOVE is quoted in basis points of yield, annualized.
Dividing either index by the square root of 252 trading days (about 16) gives the expected daily move. A VIX of 16.0 implies a daily S&P 500 move of about 1.0%. A MOVE of 106.6 implies a daily Treasury yield move of about 6.7 bps. On September 29, MOVE divided by the VIX was 6.65, higher than on 89% of days since November 2002. Because the units differ, that ratio does not mean bonds were 6.65 times as risky as stocks. The ratio also rises with the level of rates. Its correlation with the 10 Yr yield is 0.57.
Converting MOVE to price volatility
To compare the two indexes, we need MOVE in percent of price, the unit of the VIX. Modified duration makes that conversion. It is the percentage change in a bond's price for a 1 percentage point change in its yield. Multiplying MOVE by the modified duration of the four Treasuries, using MOVE's weights, gives the implied price volatility of the Treasury basket. On September 29, the weighted duration was 7.2 years, and the implied price volatility was 7.70%.
We call the VIX divided by this price volatility the risk multiple (Figure 1). On September 29, it was 2.08. The options market expected the S&P 500 to be 2.08 times as volatile as the Treasury basket over the next month. That is below the median of 2.50 since 2002 and lower than on 77% of days. Treasuries are unusually volatile relative to stocks, but less so than the raw ratio suggests. High yields shorten duration, so each basis point of yield volatility moves prices less. The conversion lowers the correlation with the 10 Yr yield from 0.57 to 0.37.
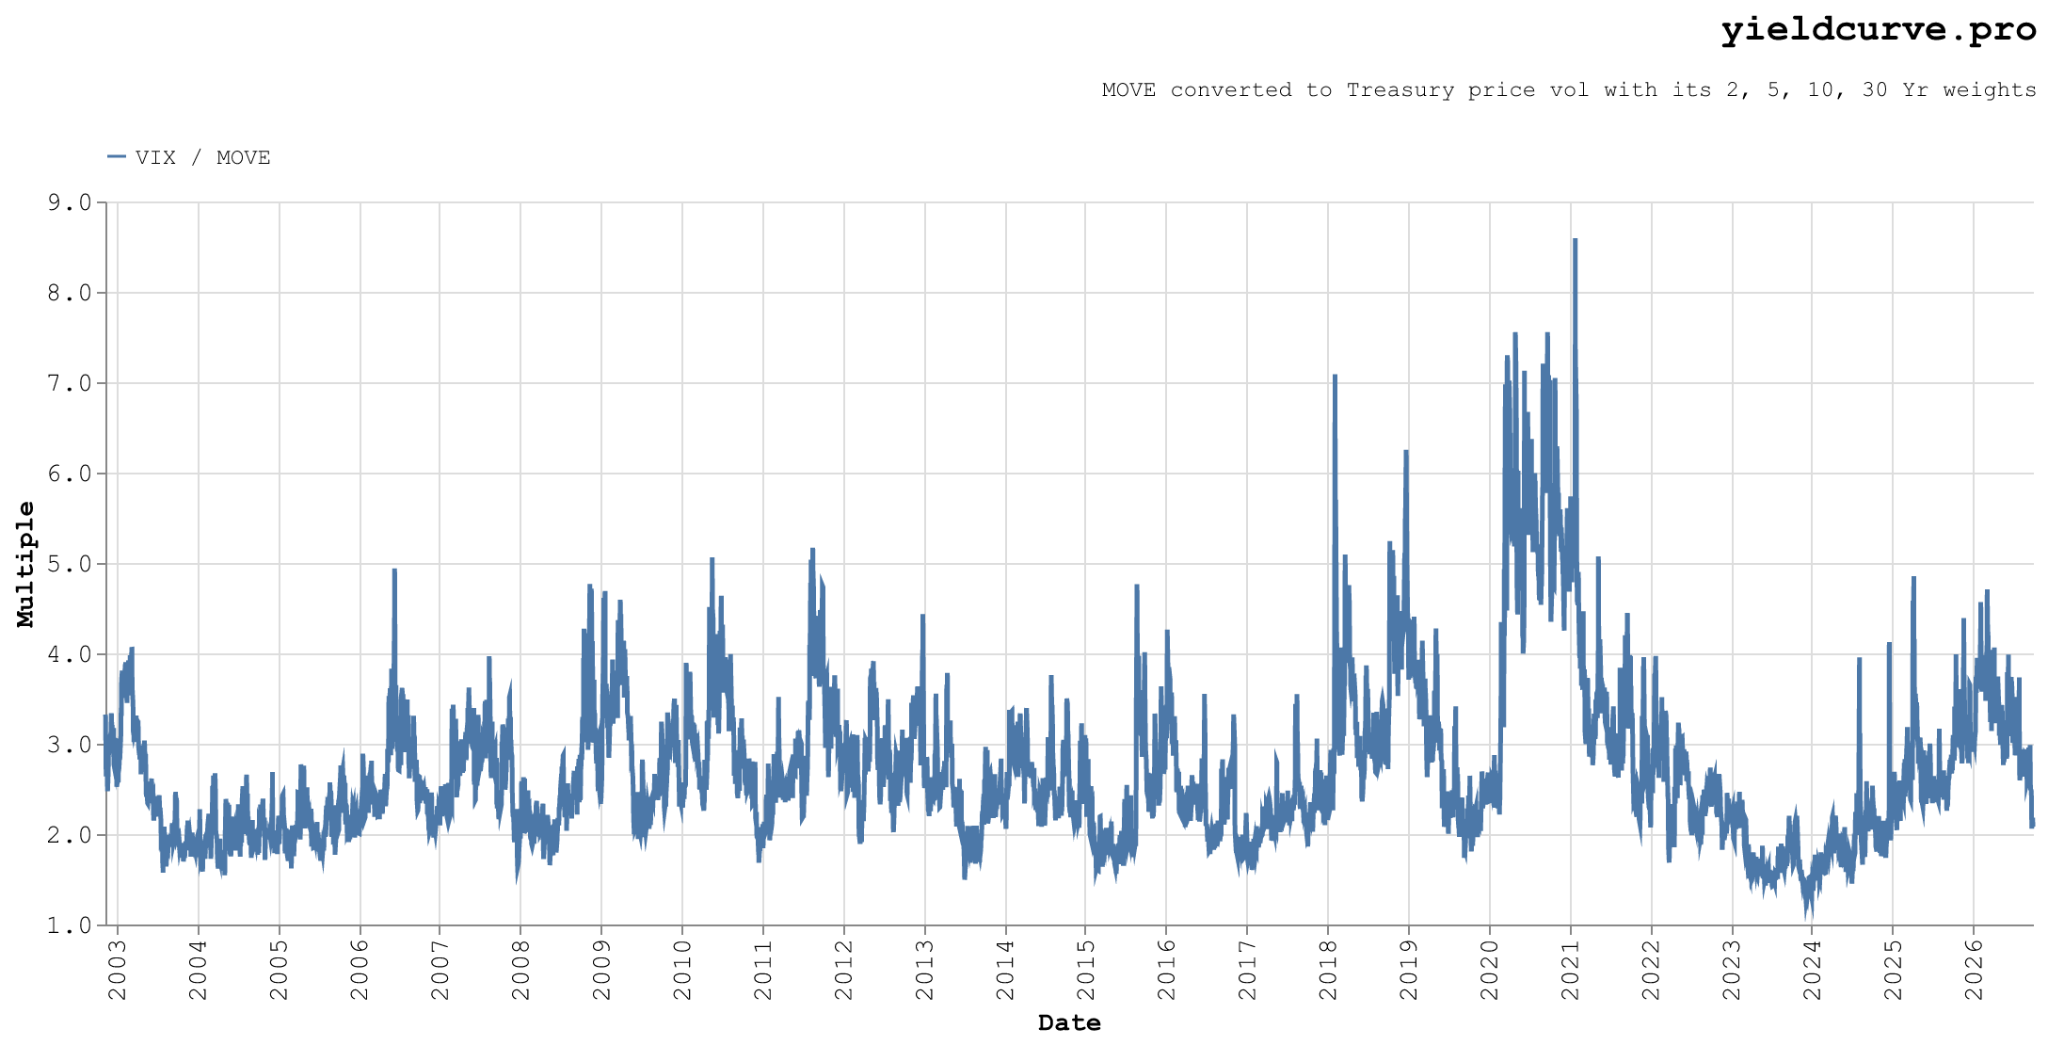
Figure 1: VIX divided by the implied price volatility of the MOVE Treasury basket, daily from 2002-11-12 to 2026-09-29. Source: ICE BofA MOVE and Cboe VIX via Yahoo Finance, Treasury par yields from Treasury.gov.
The multiple ranged from 1.27 in December 2023 to 8.59 in January 2021. It averaged 4.24 in 2020 and 2021. Short-term yields were near zero then, which kept Treasury volatility low. It averaged 1.83 in 2023 and 2024, when MOVE stayed high and the VIX fell.
What the comparison shows
These swings reflect where stress originates. When MOVE rises and the VIX does not, the uncertainty concerns interest rates and Federal Reserve policy. When the VIX rises and MOVE does not, the uncertainty concerns growth and earnings. When both rise, the stress is broad. Table 1 shows five episodes.
| Episode | Date | MOVE | VIX | Multiple |
|---|---|---|---|---|
| Fed tapering announcement | 2013-07-05 | 117.9 | 14.9 | 1.49 |
| Silicon Valley Bank failure | 2023-03-20 | 182.6 | 24.1 | 1.60 |
| Lehman Brothers failure | 2008-10-10 | 264.6 | 69.9 | 3.30 |
| US tariff announcement | 2025-04-08 | 139.9 | 52.3 | 4.85 |
| Covid-19 pandemic | 2020-03-16 | 124.5 | 82.7 | 6.53 |
Table 1: Both indexes on the day the more stressed index peaked in each episode. A low multiple indicates rate stress. A high multiple indicates equity stress.
Figure 2 plots every day since 2002. Points from 2020 and 2021 lie to the left, with low MOVE and high VIX. Points from 2022 to 2026 lie to the right of those from 2010 to 2015 and 2016 to 2019. On days when the VIX was between 15 and 20, the median MOVE was 92 from 2022 to 2026, against 79 from 2010 to 2015 and 64 from 2016 to 2019.
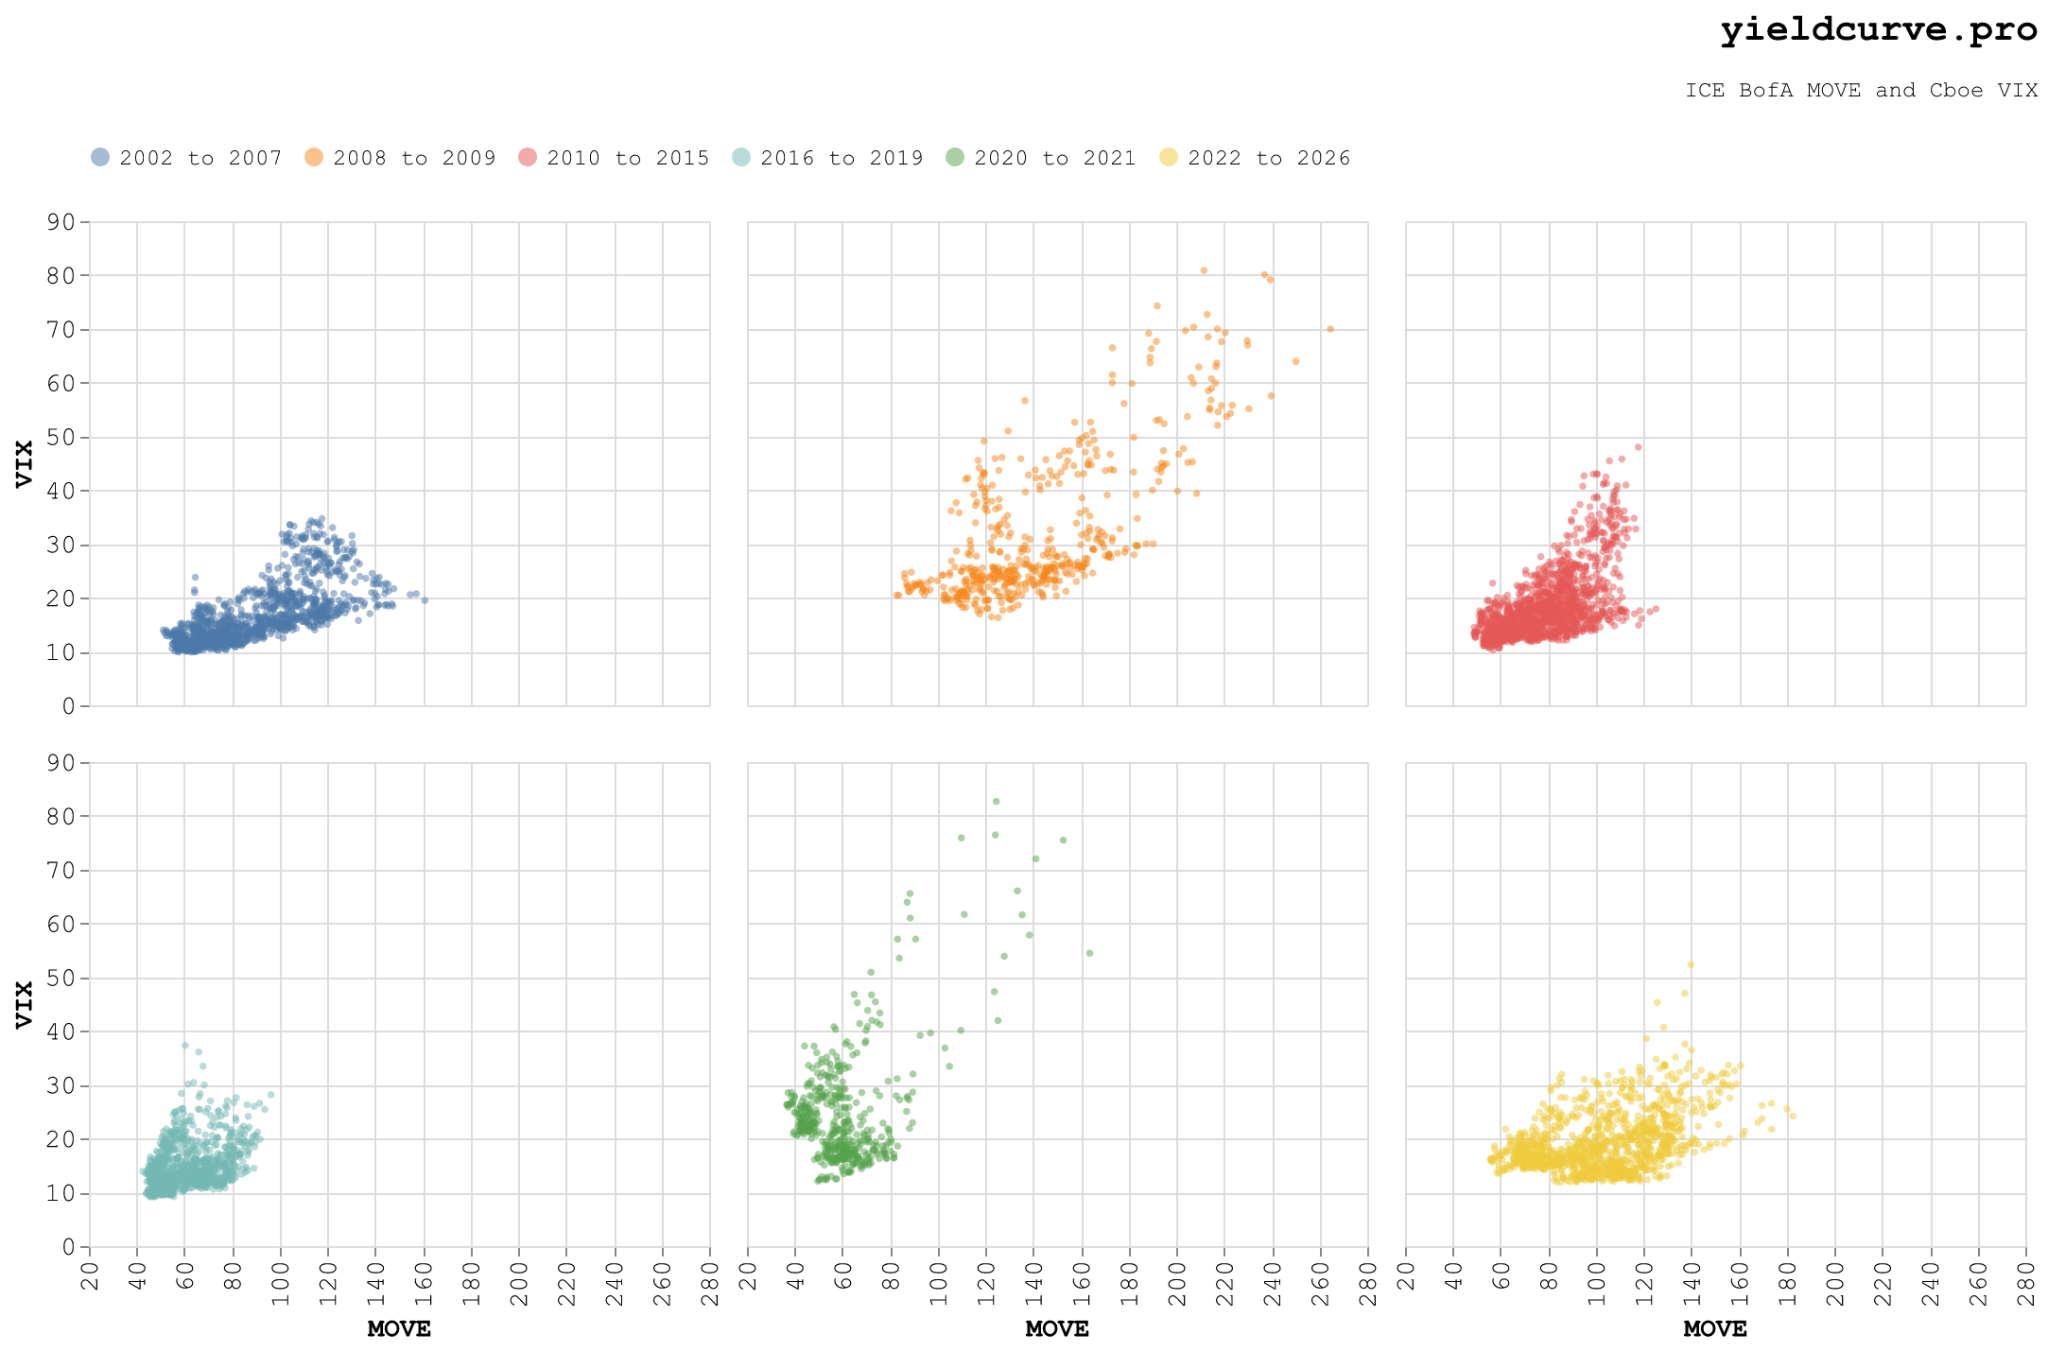
Figure 2: Daily VIX against daily MOVE, 2002-11-12 to 2026-09-29, one panel per era on shared axes. Source: ICE BofA MOVE and Cboe VIX via Yahoo Finance.
What the comparison does not predict
We tested four claims that the comparison predicts what comes next. Each test used only data available on the forecast date.
The first claim is that MOVE leads the VIX. Past changes in MOVE do not predict changes in the VIX on calm days, on stressed days or from month to month. We define a stressed day as one on which both indexes are above their 75th percentile to date. On calm days, the reverse holds, and the VIX leads MOVE by one day. Part of that lead may reflect the different closing times of the two indexes. A CFA Institute study reports the same daily lead. Cremers, Fleckenstein and Gandhi found that, in monthly data, shocks to Treasury implied volatility were followed by increases in the VIX, using Treasury futures options from 1988. MOVE since 2002 shows no such monthly lead.
The second claim is that a jump in MOVE without a jump in the VIX predicts a stock decline. We found 26 episodes in which MOVE's one-month rise ranked in its top 10% to date while the VIX's change was below its median. Over the following month, the VIX changed +0.1% on average, against -0.2% on all days. The S&P 500 returned +1.09%, against +0.91% on all days. Neither difference is statistically significant. The S&P 500 fell after 8 of the 26 episodes.
The third claim is that the ratio predicts the correlation between stocks and bonds. We measure that correlation with daily returns of SPY (S&P 500 ETF) and TLT (20+ Yr Treasury ETF). The correlation does rise with the ratio, from -0.34 in the lowest fifth of days to +0.03 in the highest. The past 63-day correlation, however, already contains the same information.
The fourth claim is that the indexes predict returns. No version of either index forecast next-month SPY or TLT returns better than the historical average.
Where the risk multiple helps
The risk multiple does predict relative volatility. It forecasts the realized volatility of IEF (7-10 Yr Treasury ETF) relative to SPY over the next month. We compared it with trailing realized volatility and with an exponentially weighted moving average of squared returns, using a daily decay of 0.94 (EWMA). Figure 3 scores each forecast by out-of-sample R². That is the share of forecast error removed relative to the historical average, using only past data.
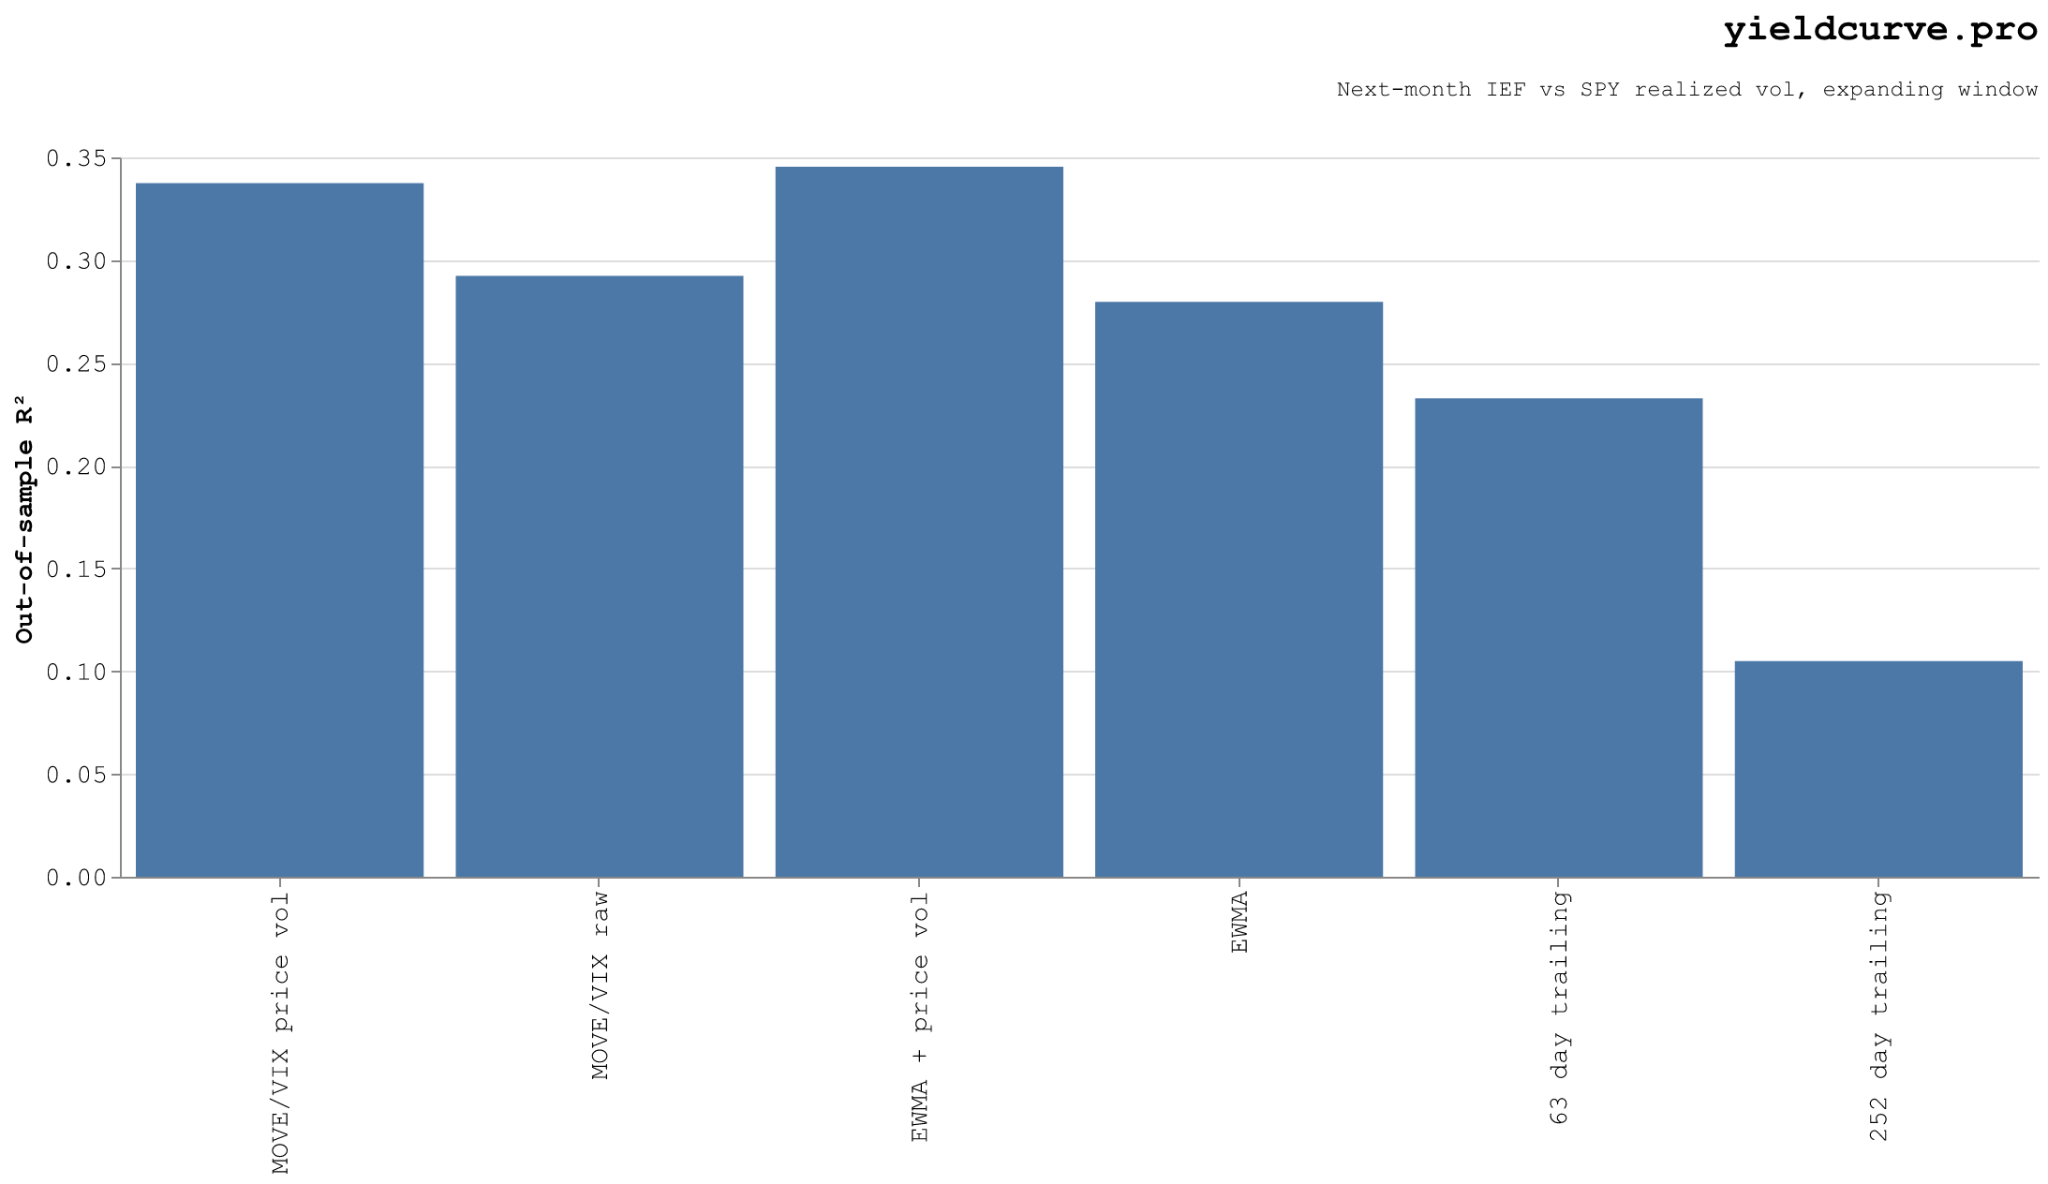
Figure 3: Out-of-sample R² of next-month IEF versus SPY realized volatility, 209 monthly forecasts from December 2008 to August 2026. Source: yieldcurve.pro calculations.
The risk multiple scored 0.338, and the raw ratio scored 0.292. A Diebold-Mariano test, which compares the accuracy of two forecasts, finds the difference significant (p = 0.005). The risk multiple also beat 63-day trailing volatility (p = 0.024). It beat EWMA by 0.338 to 0.280, but that difference is not significant (p = 0.15). The two forecasts work better together. Adding the risk multiple to EWMA raised the score to 0.345. A Clark-West test, which tests whether an added variable improves a forecast, finds the gain significant (p < 0.001). For TLT, the risk multiple added nothing to EWMA.
Implied volatility needs one correction before it can set portfolio weights. It tends to exceed the volatility that follows. On average, the VIX was 33% above later SPY volatility. Treasury implied volatility was 15% above later IEF volatility. Part of that bond gap reflects IEF's shorter duration than the MOVE basket. Because stocks carry the larger gap, weights that equalize implied risk hold too many bonds.
A monthly SPY and IEF portfolio shows the effect. With uncorrected weights, stocks carried 41.5% of the risk instead of 50%. Subtracting each asset's average gap, measured with past data only, raised that share to 49.5%. With the corrected weights, the stock share of risk differed from 50% by 21.0 percentage points per month on average. EWMA weights differed by 22.2 points, and 63-day trailing weights by 23.5. Only the improvement over trailing volatility is statistically significant.


Back
Sign in to leave a comment.
Comments (0)