Carry and Rolldown: What the Curve Pays You to Hold
Chapter 4 of The Ultimate Tourist Guide to Bondistan, written by @macropotamus, covers carry and rolldown better than most graduate textbooks. The explanation is clean, the diagrams are useful, and the intuition sticks. What it can't do is show you the numbers on today's curve.
The 2s10s spread is +51 bps. The 5 Yr yields 3.91%. Fed Funds sit at 3.50-3.75%. The curve is positively sloped and paying you to own duration. The question is how much.
What Is Carry?
Carry is the income a bond earns above its funding cost. Buy a 5 Yr Treasury at 3.91%, finance it at the Fed Funds midpoint of 3.625%, and the spread is +29 bps per year. That's carry. You collect coupon, you pay financing, and the difference is yours. In practice the funding rate is the repo rate, not Fed Funds, but the midpoint is a clean proxy and the difference is small.
For a par bond, the math is just yield minus funding rate. A 2 Yr at 3.78% carries at +16 bps. A 10 Yr at 4.29% carries at +67 bps. The yield curve sets the menu.
Carry only tells you what you earn if the funding rate and the bond's yield both stay put. That assumption does a lot of heavy lifting.
What Is Rolldown?
Rolldown is the price appreciation a bond gets from aging down a positively sloped curve. Today's 5 Yr Treasury yields 3.91%. The 3 Yr yields 3.77%. Over the next two years, that 5 Yr bond ages into a 3 Yr bond. If the curve shape doesn't change, the bond's yield falls from 3.91% to 3.77% as it slides toward the front end, and falling yields mean rising prices.
The 5 Yr to 3 Yr slope is +14 bps. Over two years, that's roughly 7 bps per year of yield decline from aging alone. With a modified duration of ~4.5 years, each basis point of yield decline translates to ~4.5 bps of price gain. Rolldown contributes roughly +32 bps of price appreciation per year on top of carry.
Rolldown only works when the curve slopes upward in the direction you're aging. A flat or inverted curve kills rolldown or turns it negative. Check the regime analysis page. Right now the curve is in positive territory across most tenors, and that's what makes rolldown worth measuring.
Carry + Rolldown = Your Baseline Return
Together, carry and rolldown define the return you earn from holding a bond position if the world stays still. No rate surprises, no spread moves, no regime shifts. Just time passing.
For the 5 Yr Note today: +29 bps of carry income and ~32 bps of rolldown price appreciation per year. That's roughly +61 bps of total expected return annually before any directional bet on rates. The rolldown calculator runs this computation across every tenor and holding period.
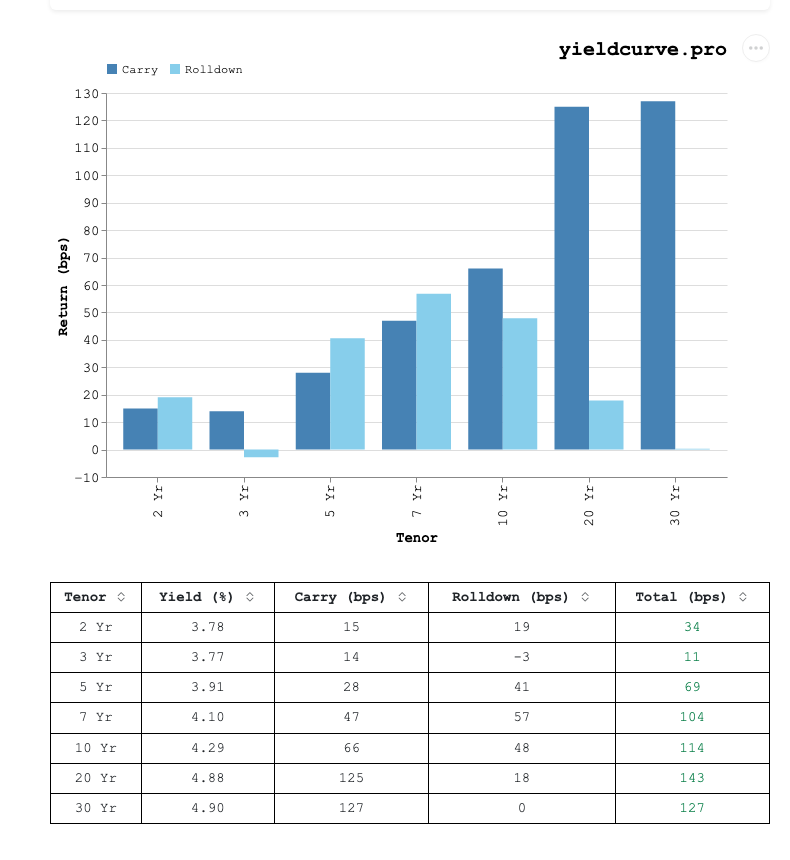
Figure 1: Carry and rolldown across tenors. The calculator shows total expected return from holding each maturity, assuming an unchanged curve.
Every duration position has a carry and rolldown profile. If you don't know what yours is, you don't know what you're getting paid to take risk.
The Breakeven: Forward Rates
Carry and rolldown tell you what you earn if rates don't move. Forward rates tell you how much rates can move against you before you start losing money.
The duration calculator shows the math. A 5 Yr Note has a modified duration of roughly 4.5 years, so every +1 bp in yield costs ~4.5 bps in price. Your +61 bps of annual carry and rolldown buys you about 14 bps of yield cushion before you're underwater. That's the breakeven: if the 5 Yr yield rises by more than ~14 bps over the next year, price losses eat the income.
Bondistan's Chapter 4 emphasizes the same point: the forward rate IS the breakeven yield. Every carry trade is a bet that realized rates will undershoot what the curve prices in. Check the scenario analysis tool to model exactly how much a parallel shift or twist costs your position.
Some of that carry compensates you for bearing duration risk, not for being clever. The term premium is the market's price for holding a longer bond instead of rolling short-term paper. When term premium is high, carry looks generous but contains less "free money" than it appears.
Where Is Carry Richest Right Now?
The belly of the curve, 5 Yr to 10 Yr, offers the highest absolute carry. The 10 Yr yields 4.29% against the same 3.625% funding cost: +67 bps of carry. The 10 Yr to 7 Yr slope provides additional rolldown. But the 10 Yr also has roughly twice the duration risk of the 5 Yr, so the carry-to-risk tradeoff depends on which tenor you pick.
Compare carry per year of modified duration. The 2 Yr carries at +16 bps on ~1.9 years of duration, or about 8 bps per unit. The 5 Yr: +29 bps on ~4.5 years, roughly 6 bps per unit. The 10 Yr: +67 bps on ~8.5 years, about 8 bps per unit. The front end wins on efficiency. The back end wins on absolute income. That tradeoff is the whole game.
The rolldown calculator shows carry and rolldown for any holding period you choose. The numbers move daily.
The Baseline
Carry and rolldown are not a strategy. They're the baseline return of any duration position. You need to know them before you can evaluate any rate view, any curve trade, or any macro thesis. Everything else, the steepener, the flattener, the butterfly, is a deviation from this baseline.
The tools to measure it are on yieldcurve.pro. Run your own numbers.
FAQ
What is carry on a Treasury position?
Carry is the income a bond earns above its funding cost over a holding period. For a par bond financed at the repo rate, $\text{carry} = y - r_f$, where $y$ is the bond yield and $r_f$ is the funding rate. When the curve is positively sloped, longer-maturity Treasuries deliver more carry than short-dated ones.
What is rolldown on a Treasury position?
Rolldown is the price appreciation a bond earns from aging down a positively sloped curve while curve shape stays fixed. A 5-year Treasury that ages into a 3-year Treasury reprices to the lower 3-year yield, generating a capital gain on top of carry. Rolldown is zero on a flat curve and negative on an inverted one.
Are carry and rolldown the same as total return?
No. Carry and rolldown define the baseline return assuming the curve does not move. Total return adds the price impact of any curve shift over the holding period, and a 100 bp parallel selloff easily erases a year of carry and rolldown on a 10-year position.
When does an inverted curve flip the sign of carry and rolldown?
Carry turns negative when the bond yield falls below the funding rate, common at the front end during an inversion. Rolldown also turns negative because a bond aging down a downward-sloping curve reprices to a higher yield. Both effects compound, which is why inverted-curve carry trades are structurally hostile to duration.
Members Only
Create a free account to keep reading.
Enter your email to get a verification code.
We sent a 6-digit code to .
Check your email and enter the code below.
Back
Sign in to leave a comment.
Comments (0)